Researcher


概要
- The value factor experienced a resurgence since November 2020
- We explore long-term performance and valuation spreads and provide expected returns for different scenarios
- Learn about the interplay between value investing and interest rates, growth expectations, and the 'Magnificent 7'
In November 2020, the announcement of a successful Pfizer-BioNTech Covid-19 vaccine candidate results triggered the long-awaited comeback of the value factor. Since then, value has been mainly on the rise. Here, in ten graphs, we review the developments since the announcement as well as some general insights on value investing.
The first chart illustrates the cumulative performance of the enhanced value strategy for a global sample of large and mid-cap stocks since 1986. We use the 'enhanced value' definition throughout this post as given in our paper Resurrecting the Value premium. However, we focus on the pooled sample of developed and emerging markets for better readability.
Figure 1: Cumulative return for the enhanced Value factor

Source: Robeco, Refinitiv. The graph shows the cumulative return of an enhanced value strategy as in Blitz and Hanauer, 2021, 'Resurrecting the value 'premium', Journal of Portfolio Management. The enhanced value strategy is based on a composite of book-to-market (R&D adjusted), EBITDA/EV, CF/P, and NPY metrics. Stocks are sorted into quintile portfolios based on the value composite and the quintile portfolios are equal-weighted. We apply region and sector neutrality for developed markets by independently ranking stocks within each region/GICS level 1 industry (11 sectors) bucket. Developed market regions are North America, Europe, and Asia-Pacific. For emerging markets, we apply country neutrality. The investment universe consists of all nonfinancial constituents of the MSCI Developed and Emerging Markets indices. Before 2001, we used the FTSE World Developed Index for developed markets (going back to December 1985), and for emerging markets, the largest 800 constituents of the S&P Emerging BMI at the semi-annual index rebalance (going back to December 1995). The sample period is January 1986 to December 2023.
Despite its solid long-term track record, the strategy also suffered during the 'quant winter' from 2018 to 2020, after which many called value investing dead. However, the announcement of successful Pfizer-BioNTech Covid-19 vaccine candidate results on 9 November 2020 triggered a new spring for the value factor. This resulted in the long-awaited value comeback, which maintained traction in 2021 and 2022 and continued through 2023 (see comments regarding 2023 in our ninth graph). Overall, the enhanced value factor has delivered attractive long-term returns despite the challenging period between 2018 and 2020. Please note that the grey-shaded area presents the out-of-sample data after posting the abovementioned paper on SSRN.
2. Valuation of Value portfolios
So, what led value strategies to perform poorly between 2018 and 2020? The poor performance stemmed mainly from an extreme widening of valuation multiples between growth and value stocks, with the former becoming relatively more expensive. Before diving into the value spread, i.e., the value of value, we first want to show the forward price-to-earnings (P/E) ratio of the cheapest and most expensive value portfolios over time.
Figure 2: Forward P/E ratio for Value quintiles (AC)

Source: Robeco, Refinitiv, I/B/E/S. The graph shows the median forward (NTM) P/E ratio for the top and bottom quintile portfolios of the enhanced value strategy. The investment universe consists of all nonfinancial constituents of the MSCI Developed and Emerging Markets indices. Before 2001, we use the FTSE World Developed Index for developed markets (going back to December 1985), and for emerging markets, the largest 800 constituents of the S&P Emerging BMI at the semi-annual index rebalance (going back to December 1995). The sample period is January 1986 to December 2023.
The chart shows the FWD P/E ratio for the top (value) and bottom (expensive) quintile portfolios of the enhanced value strategy. The investment universe consists of constituents of the MSCI Developed and Emerging Markets indices.
While the median forward P/E of value stocks is around 11 and fluctuates between 8 and 14 most of the time, the median forward P/E of the most expensive stocks is around 20; however, it also reached levels of 30 during the dot-com bubble and even higher in 2020 and 2021. Furthermore, one clearly sees that the spread in valuation between value and growth stocks substantially widened between 2018 and 2021 but has not fully normalized since then. This demonstrates that a substantial part of the outperformance of growth stocks during this period was not driven by increasing earnings but by multiple expansions.
3. The Value spread
When we take the ratio of valuation of the value and growth, we can quantify the valuation spread in one number per month. By deducing the time series median and taking the average over several valuation measures, we get a robust estimate of the abnormal valuation spread between value and growth. Consequently, a valuation spread above 1 indicates cheapness, while a reading below one implies that the factor is relatively expensive. The chart below shows the value spread over time.
Figure 3: Valuation spread for Value (AC)

Source: Robeco, Refinitiv. The graph shows the composite valuation spread between the top and bottom quintile portfolios of the enhanced value strategy. The investment universe consists of all nonfinancial constituents of the MSCI Developed and Emerging Markets indices. Before 2001, we use the FTSE World Developed Index for developed markets (going back to December 1985), and for emerging markets, the largest 800 constituents of the S&P Emerging BMI at the semi-annual index rebalance (going back to December 1995). The value spread is the average spread of the book-to-market (R&D adjusted), EBITDA/EV, and CF/P. The sample period is January 1986 to December 2023.
Interestingly, the spread has only shrunk slightly over the last two years. More specifically, it is still wider at the end of December 2023 than at the beginning of the value year-end in 2018. To put things in perspective, the current spread is about as wide as it was at the peak of the dot-com bubble in 2000.
4. Value returns vs. Value spreads
Why is value still trading at a considerable discount compared to its 2018 levels despite the recent recovery? While changes in the value spread account for a significant part of the returns, they don't explain the entire picture. Other factors – such as carry (+), portfolio migration (+), and change in fundamentals (+ or - ) – also contribute to what we call the ‘structural alpha’: a more stable component of returns. In contrast, the revaluation alpha stems from changes in the value spread. The next graph illustrates the relationship between continuously compounded annual value returns and annual changes in the log value spread.
Figure 4: Value returns vs Value spreads

Source: Robeco, Refinitiv. The figure shows the relationship between value returns and changes in value spreads. Value returns are the continuously compounded annual return on the enhanced value factor. The change in value spread is the log of ending minus the log of starting value spread. The investment universe consists of all nonfinancial constituents of the MSCI Developed and Emerging Markets indices. Before 2001, we use the FTSE World Developed Index for developed markets (going back to December 1985), and for emerging markets, the largest 800 constituents of the S&P Emerging BMI at the semi-annual index rebalance (going back to December 1995). The sample period is January 1986 to December 2023.
We observe a robust negative relationship between value returns and changes in the value spread, with the latter accounting for roughly 50% of the variation in the former. Crucially, we also document a high intercept of almost 10%. This can be interpreted as a cleaner estimate of the value premium for a hypothetical long-minus-short value factor, given that it is purged of the time-varying effects of multiple expansions and compressions.
5. Return scenarios for Value investing
The analysis above also allows us to form medium-term return expectations for the value factor based on changes in the value spread, for example, if it reverts toward its long-term average. Given the relationship estimated above and the current value spread of 1.73 at the end of December 2023, we can conduct a scenario analysis for the expected top-minus-bottom value portfolio (continuously compounded) return over the next 12 months. For instance, the value spread reverts to 1.5 as of January 2020 (pre-Covid level) or widens back to 2.2 as of June 2021.
Figure 5: Return scenarios for Value investing
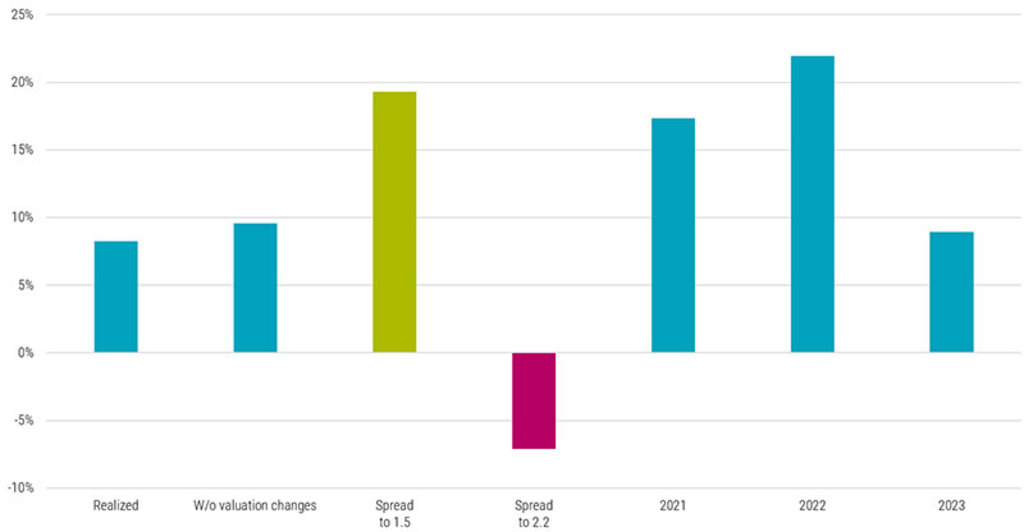
Source: Robeco, Refinitiv. The figure shows the continuously compounded annual value return over the full sample, the expected value return assuming no changes in the value spread and assuming that the value spread will go to 1.5 and 2.2 within the next 12 months. Furthermore, we show the continuously compounded annual value return for 2021, 2022 and 2023. The expected value returns are estimated based on the regression from the previous slide. The investment universe consists of all nonfinancial constituents of the MSCI Developed and Emerging Markets indices. Before 2001, we use the FTSE World Developed Index for developed markets (going back to December 1985), and for emerging markets, the largest 800 constituents of the S&P Emerging BMI at the semi-annual index rebalance (going back to December 1995). The sample period is January 1986 to December 2023.
Furthermore, we show the average realized over the full sample period, the expected value return without valuation changes, and, for better reference, the long-short value returns of 2021, 2022, and 2023. For more background on this approach, we refer to the 2022 article on short-sightedness, rates moves and a potential boost for value.
6. Value and interest rates
A popular narrative is that the rise in interest rates caused the value comeback over the last three years. While we have already been skeptical in our 2021 article on the relationship between factors and interest rates, this narrative can also be viewed in a less technical way.
Figure 6: US Value returns vs 10-year Treasury yield changes

Source: Robeco, Refinitiv, FRED. The figure shows the returns of the US enhanced value strategy vs. contemporaneous changes in the 10-year Treasury yield. The investment universe consists of all nonfinancial US constituents of the MSCI Developed Index. Before 2001, we use the FTSE World Developed Index for developed markets (going back to December 1985). The sample period is January 1986 to December 2023.
The chart above illustrates the relationship between US value returns and contemporaneous US 10-year Treasury yield changes. The chart shows little to no relationship between the value factor and interest rate changes between 1986 and 2017. Yes, there is some correlation between 2018 and 2020, but we find very little correlation again afterward. The value-rates narrative therefore seems more like a short story than an ongoing saga.
7. Expected vs. realized growth
The key argument for the value-rates narrative is that growth stocks exhibit longer duration than their value counterparts. Therefore, they should benefit from a lower discount rate being applied to their cashflows and suffer from rising yields. We acknowledge this reasoning line but believe this is only a second-order effect. The real question is whether expensive (i.e. growth) stocks do indeed have higher future growth.
Figure 7: Expected vs. realized growth

Source: Robeco, Refinitiv, I/B/E/S. The chart shows the previous five-year realized growth in earnings and the long-term (five-year) EPS growth expectations of analysts for the top (value) and bottom (expensive) quintile portfolios of the enhanced value strategy at portfolio formation (t=0) and up to ten years (t=120) after portfolio formation. For each measure and month, we compute the median for both the cheapest and most expensive quintile and deduct the universe median. The investment universe consists of all nonfinancial constituents of the MSCI Developed and Emerging Markets indices. Before 2001, we use the FTSE World Developed Index for developed markets (going back to December 1985), and for emerging markets, the largest 800 constituents of the S&P Emerging BMI at the semi-annual index rebalance (going back to December 1995). The sample period is January 1986 to December 2023.
The chart above depicts the previous five-year realized growth in earnings and analysts’ long-term (five-year) earnings per share (EPS) growth expectations at portfolio formation (t=0), and up to ten years (t=120) after this for the cheap (‘value’) and expensive (‘growth’) quintile portfolios versus the universe. The chart shows that the spread for both historical growth and growth expectations between value and expensive firms is indeed highest at portfolio formation. However, these differences are not persistent.
As shown in the chart, the spread in both growth expectations and realized growth rapidly converges in the years after portfolio formation, with value stocks experiencing improvements in growth realizations and expectations. In contrast, their expensive peers encounter deteriorating growth realizations and expectations. Therefore, investors appear to be overpaying for the expected growth differences at portfolio formation, as analysts and other market participants extrapolate historical growth too far into the future. In other words, realized growth does not live up to expectations.
8. Decarbonizing the Value factor
Conventional value strategies tend to have high environmental footprints, including greenhouse gas (GHG) emissions. Could value stocks just look cheap using common valuation metrics, but this is mainly because their environmental footprints are not well reflected in accounting numbers? Therefore, we wondered whether we could decarbonize the value factor without significantly impacting value exposure. The short answer is ‘Yes’.
Figure 8: Decarbonizing the Value factor
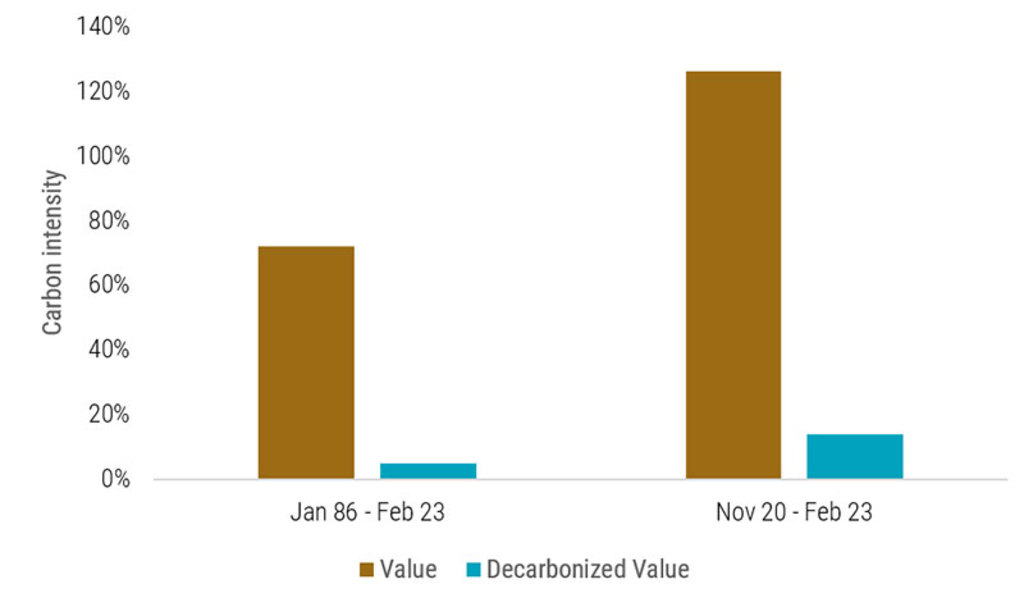
Source: Robeco, Refinitiv, Trucost. The graph shows the average and current carbon intensity of the highest value quintile portfolio minus the lowest value quintile portfolio as a percentage of the footprint of the equally-weighted universe for the conventional and decarbonized value composite. A positive number means value stocks have a larger footprint than non-value stocks. Carbon intensity is the total GHG emissions in tons of CO2 equivalent (tCO2eq) per one million USD revenues. The investment universe consists of all nonfinancial constituents of the MSCI Developed and Emerging Markets indices. The sample period is January 1986 to March 2023 (left) and November 2020 to March 2023 (right).
In our article How Value investors can avoid the climate traps we demonstrate how value strategies can be ‘decarbonized’ effectively. For example, we demonstrate that our decarbonization methodology reduces the carbon footprint without impacting exposure to the value factor. Note that we do not impose region-sector or countries neutralities in this analysis in contrast to the other points. Imposing these neutralities would have resulted in similar but less pronounced results.
9. The Magnificent Seven against the rest of the world
While we show positive returns for the long-short value factor in 2023, most of you will probably say that 2023 wasn’t a good year for pure value strategies. Our analysis shows a positive number because we present the return difference between the average value and the average growth stock across global developed and emerging markets, giving each stock the same weight. However, the Magnificent Seven that dominated global developed stock markets in 2023 were typically not included or at least underweighted in long-only value portfolios. Therefore, the underperformance of such value portfolios is actually caused by a size effect in disguise. The chart below illustrates that the Magnificent Seven were outperforming the average stock by far in 2023.
Figure 9: The Magnificent Seven against the world

Source: Robeco, Bloomberg. The graph shows the cumulative return of the MSCI World Equal Weighted Index and the Bloomberg Magnificent Seven Index. The sample period is December 30, 2022 to December 29, 2023.
Furthermore, value portfolios in emerging markets typically outperformed their cap-weighted benchmarks in 2023.
10. Emerging vs. developed markets
Finally, investors can also find value not only within one market but also across markets. Systematic country or market selection based on valuation multiples should be applied with caution as it represents a rather low breadth game, i.e., just a few countries or markets to select versus thousands of stocks. However, decomposing relative returns with changes in relative valuation can still give valuable insights, as we did in our recent article Double delight: Seizing the dual discount in emerging markets.
Figure 10: MSCI Emerging Markets vs MSCI World

Source: Robeco, MSCI. The figure shows the relative performance and valuation spread of the MSCI Emerging Market Index vs. the MSCI World Index. Performance is measured via the total return index, and the valuation spread is based on four bottom-up-calculated multiples (price-to-book, price-to-earnings, price-to-cash EPS, and price-to-dividend). For each multiple, the valuation ratio of the MSCI Emerging Markets Index is divided by the same valuation ratio for the MSCI World Index. The sample period is September 1995 to December 2023.
Applying the same methodology as in this paper, we see that emerging market equities currently offer a substantial discount over developed markets. Moreover, the underperformance of emerging markets over the past decade has been more of a function of changes in relative valuation rather than deteriorating fundamentals.
獲取最新市場觀點
訂閱我們的電子報,時刻把握投資資訊和專家分析。

Active Quant: finding alpha with confidence
Blending data-driven insights, risk control and quant expertise to pursue reliable returns.
重要資料
本網站僅供《證券及期貨條例》(香港法例第571章)及其附屬法例所界定之專業投資者瀏覽及使用。 投資涉及風險。過往表現並不代表未來表現。本網站所載資料僅供參考之用,並不構成任何投資建議,亦非作出買賣任何證券或採納任何投資策略之要約或招攬。投資者不應僅憑本網站提供之資料作出投資決定,在作出任何投資決定前,應徵詢獨立意見(包括有關稅務影響之意見)。投資者應確保完全理解投資產品的相關風險,亦應考量自身投資目標及風險承受水平。投資乃閣下之個人決定。除非銷售投資產品的中介人已向閣下告知該投資產品適合閣下,並已解釋其符合閣下投資目標之原因,否則閣下不應投資。請參閱相關發售文件或其他法律文件,以獲取包括風險因素在內的進一步詳情。 本網站由荷寶投資管理香港有限公司發布,該公司受香港證券及期貨事務監察委員會(「證監會」)規管(中央編號:APU851)。本網站未經證監會審閱。 無法保證任何投資產品可實現其投資目標。概不就任何投資產品之表現或投資回報作任何聲明或承諾。投資的價值或會波動。本網站所載過往表現、推算或預測,均不應視作未來表現之保證或指標,且概不提供任何明示或暗示之保證。本網站內容建基於相信為可靠之來源,惟因應資料傳遞技術特性及須採用多項數據來源(包括第三方內容),故概不保證其準確性。所述觀點僅乃截至上述日期,或會隨市況變化而改變,可予更改而毋須另行通知。該等意見可能有別於其他荷寶投資專業人士之意見。因使用本材料或當中所載任何評論、意見或估算而引致之直接、間接或相應損失,荷寶概不承擔法律責任。荷寶並無責任更新本網站或任何網站內容。未經荷寶事先書面許可,不得複製、分發或刊發本網站任何材料。 除非另有說明,資料來源:荷寶。