Global Head of Client Portfolio Management


• 市場觀點
Double delight: Seizing the dual discount in emerging markets
Is now the time to seize investment opportunities in emerging markets? We believe the answer is a resounding 'Yes.'
作者






Researcher
概要
- Emerging markets equities offer a substantial discount over developed markets
- EM value strategies are currently trading at historically low valuations
- Robeco Quant EM strategies are designed to efficiently capture both market and factor premiums
Based on historical valuation metrics, both absolute and relative, we believe the time is ripe to seize the dual discount in emerging markets. Our recent research outlines this 'double discount' opportunity presented by emerging markets factor-based equities and highlights how Robeco Quant Equities strategies are specially designed to capture both market and factor premiums efficiently.
This change doesn't spell doom for emerging markets; rather, it highlights an underexplored 'double discount' investment opportunity
For over a decade, developed markets have enjoyed the boon of falling interest rates, catapulting growth stocks to sky-high valuations. However, this landscape has shifted as central banks raise interest rates to combat inflation. This change doesn't spell doom for emerging markets; rather, it highlights an underexplored 'double discount' investment opportunity.
Emerging markets have suffered from an image problem, often viewed as underperforming compared to their developed counterparts, as discussed in a recent article. But this perception masks a more nuanced reality. Our data, illustrated in Figure 1, shows that emerging markets outperformed developed ones from 1999 to 2011 but have lagged since.
The data also reveals that emerging markets tend to outperform when they become relatively more expensive than developed markets and underperform when they become cheaper. Currently, the value spread between emerging and developed markets is at levels last seen 20 years ago—right when emerging markets began to outperform their developed counterparts.
Figure 1 – Relative performance and valuation of emerging markets versus developed markets (January 1996 to July 2023)
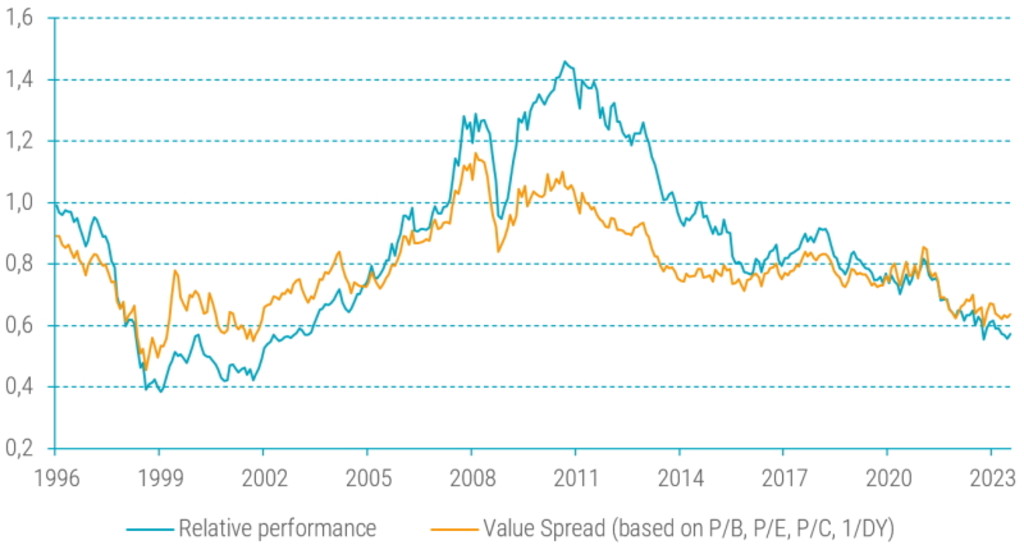
Source: Robeco, MSCI. The figure shows the relative performance and valuation spread of the MSCI Emerging Market Index vs. the MSCI World Index. Performance is measured via the total return index, and the valuation spread is based on four bottom-up-calculated multiples (price-to-book, price-to-earnings, price-to-cash EPS, and price-to-dividend). For each multiple, the valuation ratio of the MSCI Emerging Markets Index is divided by the same valuation ratio for the MSCI World Index. The sample period is January 1996 to July 2023.
In essence, the decline of emerging markets over the past decade has been more a function of changes in relative valuation rather than deteriorating fundamentals. In fact, annual fluctuations in these valuations account for over 75% of the variation in performance between emerging and developed markets, as seen in Figure 2.
Figure 2 – Relative performance and valuation of emerging versus developed markets
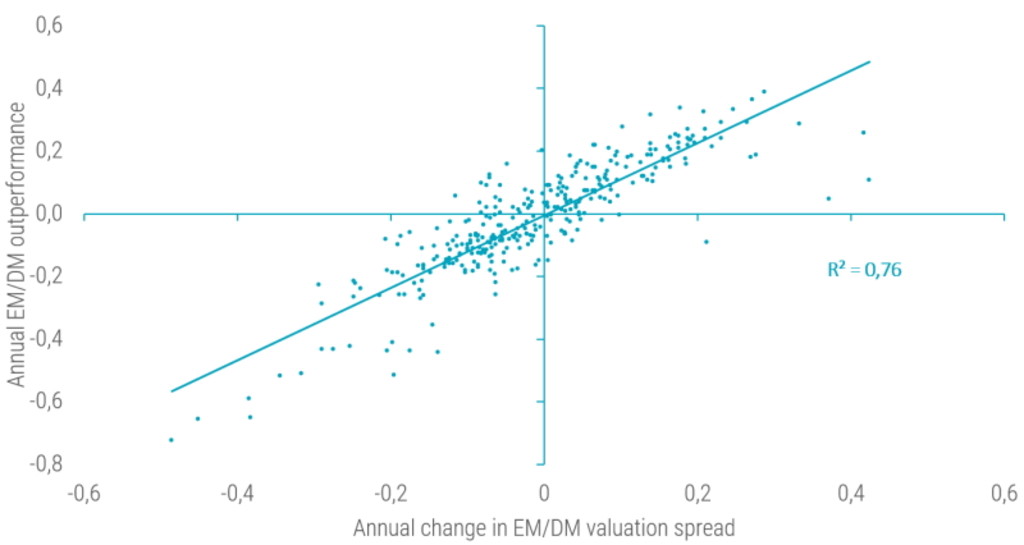
Source: Robeco, MSCI. The figure shows the relationship between the relative performance and changes in valuation spreads for the MSCI Emerging Market Index vs. the MSCI World Index. Relative performance is the continuously compounded 12-month relative performance, while the change in the valuation spread is the log of the ending value spread minus the log of the starting valuation spread. Performance is measured via the total return index and the valuation spread is based on four bottom-up-calculated multiples (price-to-book, price-to-earnings, price-to-cash EPS, and price-to-dividend). For each multiple, the valuation ratio of the MSCI Emerging Markets Index is divided by the same valuation ratio for the MSCI World Index. The sample period is January 1996 to July 2023.
How Value factors in
Within this broader landscape, value stocks in emerging markets offer a particular appeal. The valuation spread between value and growth stocks remains wider than usual, providing a fertile ground for investors.1
Figure 3 – Value trading at a historic discount in developed markets and even more so in emerging markets
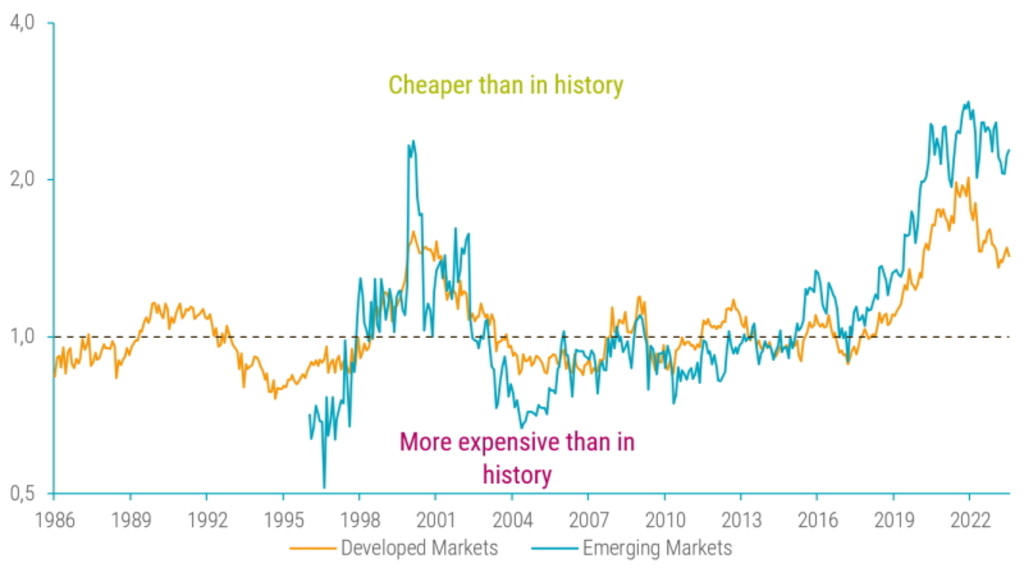
Source: Robeco, Refinitiv. The figure shows the valuation spread between the top and bottom quintile portfolios of a value strategy for developed and emerging markets. Details regarding the definition of the value strategy and the valuation spread are provided in footnote 1. The investment universe consists of constituents of the MSCI World and MSCI Emerging Markets indices. Before 2001, we use the FTSE World Developed Index for developed markets (going back to December 1985), and for emerging markets, the largest 800 constituents of the S&P Emerging BMI at the semi-annual index rebalance (going back to December 1995). The sample period is December 1985 and December 1995 to July 2023 for developed and emerging markets, respectively.
Structural and realized alpha
Why is it that despite a recent recovery in value, these stocks are still trading at a considerable discount compared to their 2018 levels? While changes in the value spread account for a significant part of the returns, they don't explain the entire picture. Read our full article on how the realized value return can be decomposed in a structural and revaluation alpha and how this decomposition can be used to form medium-term return expectations for the value factor in emerging markets. Moreover, we explain how Robeco's strategies have successfully capitalized on value and other factors such as quality, momentum, analyst revisions and novel next-gen factors.
Double discount
The current 'double discount' in emerging markets offers a golden investment opportunity, particularly as central banks in developed nations near the end of their monetary tightening cycles. Our multifaceted EM strategies not only aim for high risk-adjusted returns but also focus on sustainable investment dimensions, making these well-poised to leverage this unique market moment.
Footnotes
1 We define value and the value spread as in Blitz, D. C., and Hanauer, M. X., January 2021, “Resurrecting the value premium”, Journal of Portfolio Management. More specifically, the value strategy is based on a composite of book-to-market (R&D adjusted), EBITDA/EV, CF/P, and NPY. Value stocks are sorted into quintile portfolios based on the valuation composite and in a region and sector respectively country neutral manner for developed and emerging markets. Quintile portfolios are equal-weighted and reformed monthly. The value spread is expressed as the ratio of a basket of valuation multiples of the top and bottom quintile value portfolios. We control for value spread differences that are normally observed between both portfolios, such that a value spread above one indicates cheapness. Since cheap stocks by definition have higher fundamental value to price ratios than their expensive peers, it is particularly important for the value factor to scale the value spread by its historical normal level.
重要資料
本網站僅供《證券及期貨條例》(香港法例第571章)及其附屬法例所界定之專業投資者瀏覽及使用。 投資涉及風險。過往表現並不代表未來表現。本網站所載資料僅供參考之用,並不構成任何投資建議,亦非作出買賣任何證券或採納任何投資策略之要約或招攬。投資者不應僅憑本網站提供之資料作出投資決定,在作出任何投資決定前,應徵詢獨立意見(包括有關稅務影響之意見)。投資者應確保完全理解投資產品的相關風險,亦應考量自身投資目標及風險承受水平。投資乃閣下之個人決定。除非銷售投資產品的中介人已向閣下告知該投資產品適合閣下,並已解釋其符合閣下投資目標之原因,否則閣下不應投資。請參閱相關發售文件或其他法律文件,以獲取包括風險因素在內的進一步詳情。 本網站由荷寶投資管理香港有限公司發布,該公司受香港證券及期貨事務監察委員會(「證監會」)規管(中央編號:APU851)。本網站未經證監會審閱。 無法保證任何投資產品可實現其投資目標。概不就任何投資產品之表現或投資回報作任何聲明或承諾。投資的價值或會波動。本網站所載過往表現、推算或預測,均不應視作未來表現之保證或指標,且概不提供任何明示或暗示之保證。本網站內容建基於相信為可靠之來源,惟因應資料傳遞技術特性及須採用多項數據來源(包括第三方內容),故概不保證其準確性。所述觀點僅乃截至上述日期,或會隨市況變化而改變,可予更改而毋須另行通知。該等意見可能有別於其他荷寶投資專業人士之意見。因使用本材料或當中所載任何評論、意見或估算而引致之直接、間接或相應損失,荷寶概不承擔法律責任。荷寶並無責任更新本網站或任何網站內容。未經荷寶事先書面許可,不得複製、分發或刊發本網站任何材料。 除非另有說明,資料來源:荷寶。