Portfolio Manager


• 市場觀點
Beyond the Big Three: Mapping Asia's AI hardware rally
In a new paper by Robeco’s EM quantitative and fundamental equity teams, we shed light on the broader technology ecosystem in Taiwan and Korea through ten key steps in the AI value chain. Against the backdrop of the phenomenal rally in Asian hardware stocks, we highlight how our quant and fundamental strategies are navigating the current technology boom, as well as the opportunities and risks that come with it.
作者






Client Portfolio Manager
概要
- AI rally has mostly taken place in EM names beyond index heavyweight TSMC
- EM hardware stocks can be classified across ten steps of AI value chain
- Robeco’s EM strategies combine performance with balanced exposure
Today, around 30% of the MSCI EM Index is accounted for by just three stocks: TSMC1 (14.5% index weight; USD 1.97 trillion market cap), Samsung Electronics (9.3%; USD 1.3 trillion) and SK Hynix (6.8%; USD 1.1 trillion), up from a combined index weight of 12% just three years ago. TSMC’s large index weight creates a dilemma for active UCITS-regulated EM funds, where single-stock exposure is typically capped at 10%, leading to a structural underweight in the semiconductor giant.
Beyond TSMC, hundreds of specialized Taiwanese and Korean technology companies have enjoyed impressive share price gains. Figure 1 shows the year-to-date returns of the Taiwanese and Korean tech stocks in our investable universe. For active stock pickers, the opportunity set extends far beyond the most obvious winners, but the characteristics of these companies vary widely. They operate across different parts of the AI value chain, each with its own supply-demand dynamics and competitive landscape, resulting in distinct profitability and valuation profiles. The opportunities are abundant, but after such a powerful rally, investors must remain disciplined on fundamentals, valuations and earnings expectations.
Figure 1 – 2026 returns for the Taiwanese and Korean technology stocks in our EM universe
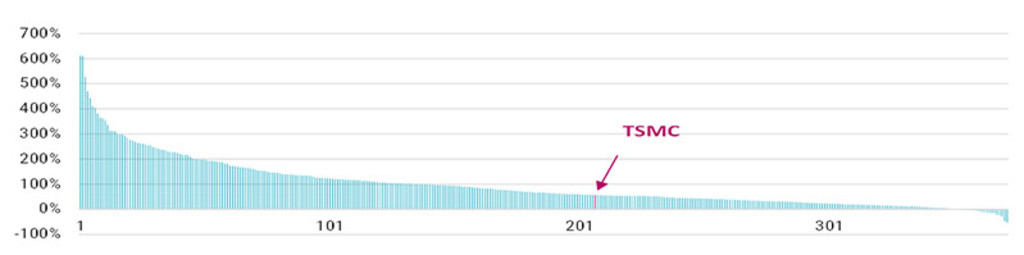
Past performance does not guarantee future results. The value of your investments may fluctuate. TSMC and all other companies named in the charts in this article are for illustrative purposes only. No inference can be made on the future development of the company. This is not a buy, sell or hold recommendation.
Source: Bloomberg, Robeco. As of 10 June 2026. Local total stock returns for the Taiwanese and Korean tech stocks in our EM Active universe.
To map the vast Asian hardware ecosystem and the phenomenal returns many of these stocks have delivered – and in many cases have resulted in rich valuations – we start by categorizing ten steps of the AI infrastructure value chain, from chip design to server building. Figure 2 outlines and explains the ten steps we have identified.2 We focus here on Taiwanese and Korean stocks, given the dominance of Taiwanese names in the current AI infrastructure boom. 3
Figure 2 – The ten steps in the AI value chain
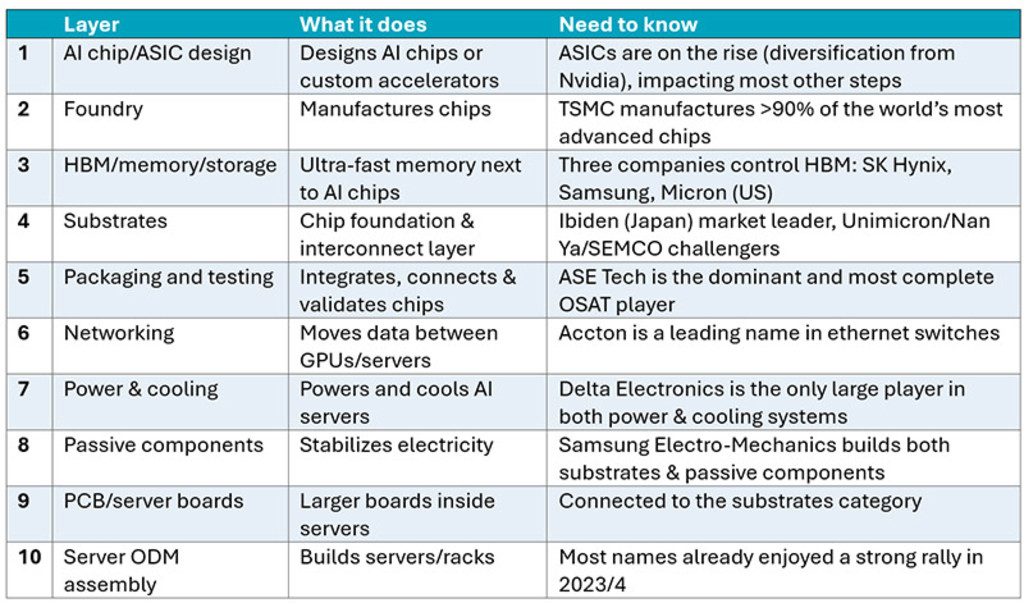
Source: Robeco.
Figure 3 shows the market capitalization, returns and valuations of the main stocks in each category. The AI rally has been broad, although return dispersion has also been high, including when looking at five-year returns as shown below.
Figure 3 – The main Taiwanese and Korean companies per step in the AI value chain
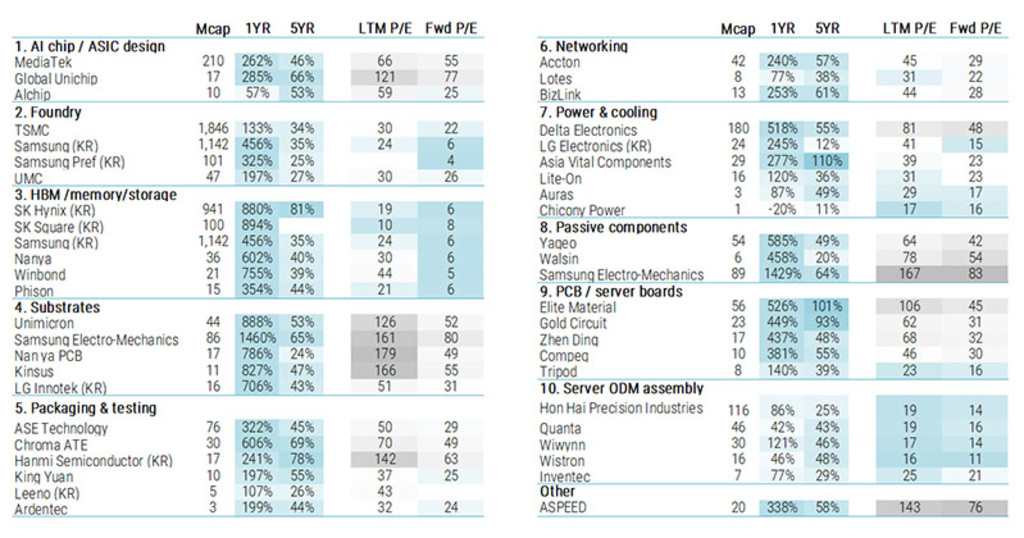
Note: The shortage in memory chips is well-documented by now, but also less visible parts like substrates, passive components, and server boards are expected to continue to be real bottlenecks in the AI server and datacenters expansion. The rally has led to large valuation differences, also when comparing trailing P/E with forward P/E. Many stocks are now trading at high forward price/earning ratios, implying the market is expecting explosive earnings growth.
Past performance does not guarantee future results. The value of your investments may fluctuate. The companies shown in this graph are for illustrative purposes only. No inference can be made on the future development of the company. This is not a buy, sell or hold recommendation.
Source: Robeco analysis; Bloomberg. ‘Mcap’ = Market cap in USD billion as of 5 June 2026. Returns as of 10 June 2026.
The current bull market for Asian hardware stocks in a five-year perspective
As the saying goes, a picture is worth a thousand words. Figure 4 illustrates the five-year share price performance of the three largest stocks in each category and highlights the breadth of the Asian technology rally. Performance, however, has varied widely across segments. In the PCB/server board category, some stocks have risen more than 20-fold over the past five years, while ODM server manufacturers have posted impressive gains of three to seven times. The timing of the rally has also differed. Server assemblers such as Quanta and Wiwynn, for example, captured most of their gains before 2026, ahead of many other beneficiaries of the AI infrastructure buildout.
Figure 4 – Five-year indexed returns of top-three players in each of the ten categories
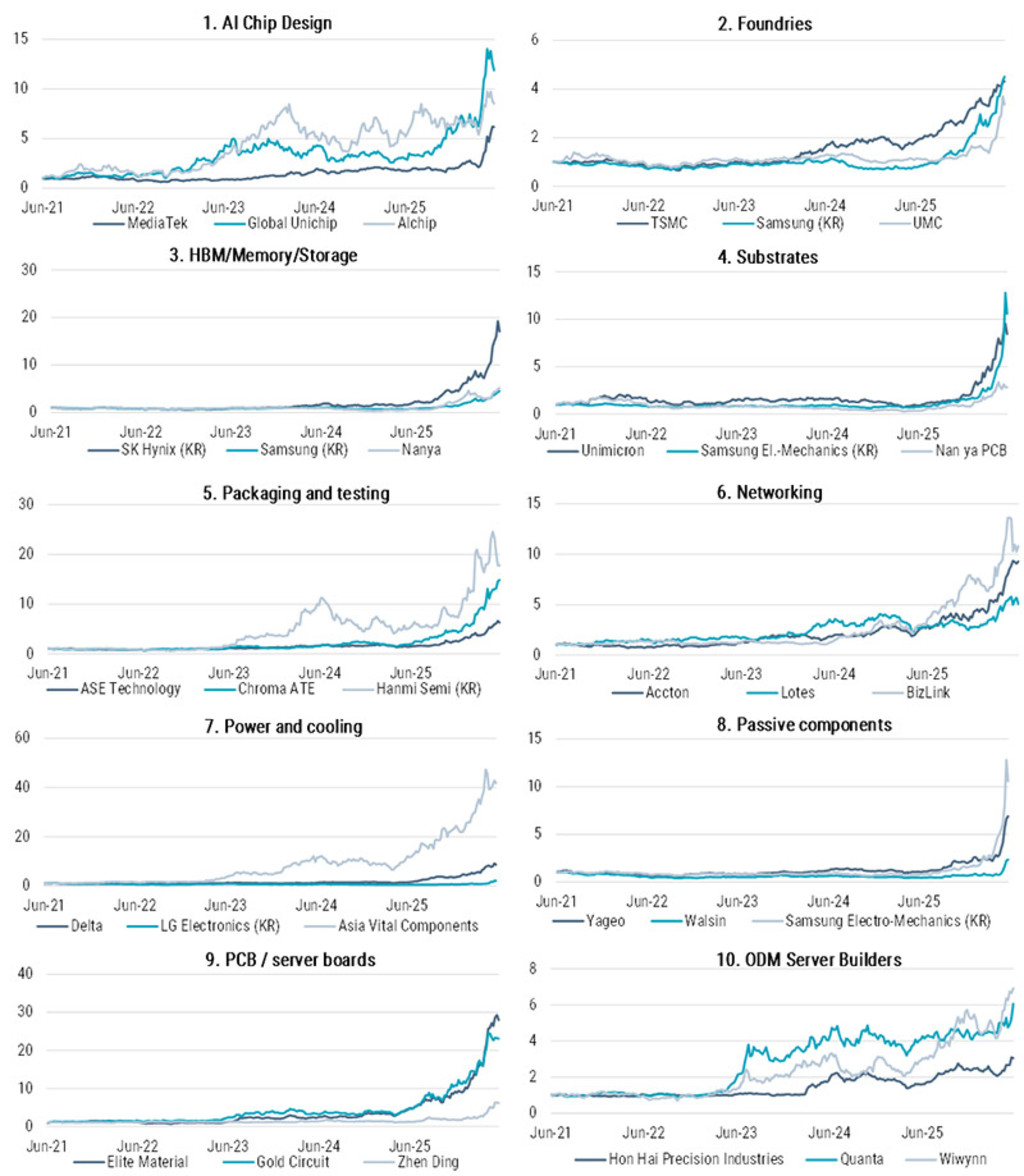
Past performance does not guarantee future results. The value of your investments may fluctuate. The companies shown in this graph are for illustrative purposes only. No inference can be made on the future development of the company. This is not a buy, sell or hold recommendation. Source: Robeco, Bloomberg. Five-year indexed returns as of 10 June 2026.
Outlook
The Asian technology rally is approaching an inflection point, where structural realities and market discipline are beginning to outweigh narrative. The bottlenecks are real and persistent – constraints in advanced packaging (notably CoWoS), specialized substrates and thermal cooling remain binding, effectively anchoring supply as hyperscaler capex continues to expand. This supports pricing power and provides clear earnings visibility across these midstream hardware segments.
What is shifting, however, is market behavior. The first phase of the rally was broad-based and momentum-driven; the next phase is likely to be far more selective. With valuations pricing in near-perfect execution, particularly across Taiwanese hardware, dispersion is set to increase meaningfully. Alpha will be driven by quality: companies with durable cash-flow generation, strong balance sheets, and genuine pricing power to absorb rising input costs and capital intensity.
At the same time, the global technology stack is becoming more fragmented. While Taiwan and Korea remain central to frontier AI infrastructure, particularly in training, China is rapidly building a parallel and increasingly self-reliant ecosystem. As the industry shifts toward inference, localized architectures and custom ASICs are gaining traction, while downstream Chinese players are establishing a structurally relevant competitive counterweight.
In this environment, passive exposure becomes increasingly constrained, both by index concentration and regulatory limits. A more effective approach is inherently active; combining systematic signals, such as earnings revisions and momentum, with fundamental oversight to navigate geopolitics, supply chain dynamics and corporate complexity. This allows for disciplined positioning, including selective rotation away from extended Taiwanese exposures into high-quality Korean or regional names where valuations offer a more attractive margin of safety.
獲取最新市場觀點
訂閱我們的電子報,時刻把握投資資訊和專家分析。
Conclusion
Although both our quantitative and fundamental strategies maintain mostly neutral exposure to the Asian hardware sector, both styles have continued to deliver strong results throughout the AI-driven rally through successful active country allocation and/or bottom-up stock picking. This demonstrates that performance is not dependent on a single technology trend, but is driven by the ability to identify opportunities across the full emerging markets universe.
We pursue this opportunity in different yet complementary ways. Our quantitative EM strategies focus on bottom-up, rules-based stock selection through hundreds of small active positions, while our fundamental EM strategies combine top-down country analysis with high-conviction stock selection. Through a culture of close collaboration, we leverage each team’s strengths, making Robeco a leading EM investment platform with long and proven track records of adding value across a wide range of market environments.
Footnotes
1 TSMC and all other companies named in this article are for illustrative purposes only. No inference can be made on the future development of the company. This is not a buy, sell or hold recommendation.
2 Needless to say, this is just one possible framework for understanding the AI value chain; in reality, it is a vast, complex and highly interconnected ecosystem.
3 Many of these companies have competition from mainly American, Japanese and Chinese companies.
重要資料
本網站僅供《證券及期貨條例》(香港法例第571章)及其附屬法例所界定之專業投資者瀏覽及使用。 投資涉及風險。過往表現並不代表未來表現。本網站所載資料僅供參考之用,並不構成任何投資建議,亦非作出買賣任何證券或採納任何投資策略之要約或招攬。投資者不應僅憑本網站提供之資料作出投資決定,在作出任何投資決定前,應徵詢獨立意見(包括有關稅務影響之意見)。投資者應確保完全理解投資產品的相關風險,亦應考量自身投資目標及風險承受水平。投資乃閣下之個人決定。除非銷售投資產品的中介人已向閣下告知該投資產品適合閣下,並已解釋其符合閣下投資目標之原因,否則閣下不應投資。請參閱相關發售文件或其他法律文件,以獲取包括風險因素在內的進一步詳情。 本網站由荷寶投資管理香港有限公司發布,該公司受香港證券及期貨事務監察委員會(「證監會」)規管(中央編號:APU851)。本網站未經證監會審閱。 無法保證任何投資產品可實現其投資目標。概不就任何投資產品之表現或投資回報作任何聲明或承諾。投資的價值或會波動。本網站所載過往表現、推算或預測,均不應視作未來表現之保證或指標,且概不提供任何明示或暗示之保證。本網站內容建基於相信為可靠之來源,惟因應資料傳遞技術特性及須採用多項數據來源(包括第三方內容),故概不保證其準確性。所述觀點僅乃截至上述日期,或會隨市況變化而改變,可予更改而毋須另行通知。該等意見可能有別於其他荷寶投資專業人士之意見。因使用本材料或當中所載任何評論、意見或估算而引致之直接、間接或相應損失,荷寶概不承擔法律責任。荷寶並無責任更新本網站或任何網站內容。未經荷寶事先書面許可,不得複製、分發或刊發本網站任何材料。 除非另有說明,資料來源:荷寶。