Researcher


• 市場觀點
Spring has sprung for Value investing
Despite the recent rally in cheap stocks, we believe the Value upswing still has a way to go. Spreads in valuation multiples between growth and Value stocks remain high, while fundamentals and sentiment have improved in recent months for the latter. Thus, after a long and harsh ‘quant winter’, spring has sprung and Value seems ready for summer.

概要
- Despite the recent Value rally, spreads in valuation multiples remain wide
- Fundamentals and growth forecasts contradict the 'cheap for a reason' tag
- Market sentiment is becoming a tailwind for Value stocks
The long-awaited value comeback was triggered by the announcement of successful Pfizer-BioNTech Covid-19 vaccine candidate results on 9 November 2020. This culminated in strong returns for the value factor in the first quarter of 2021. Despite this rally, the spread in valuation multiples between expensive and cheap stocks remains at exceptionally high levels. Indeed, Figure 1 shows that the gap has surpassed levels last seen at the height of the tech bubble in the late 1990s, based on an enhanced value factor.1
Figure 1 | Composite valuation spread for the enhanced value strategy
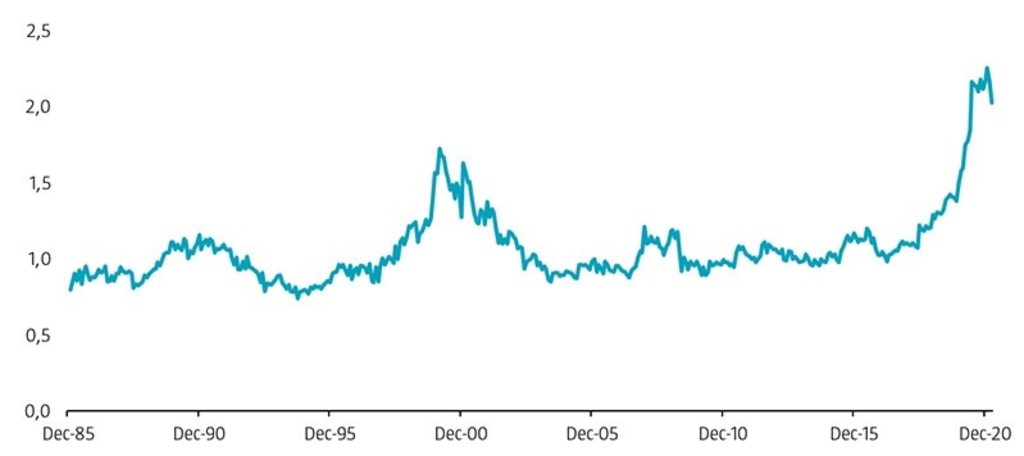
Source: Refinitiv. The figure shows the composite valuation spread between the top and bottom quintile portfolios of the enhanced value strategy. The investment universe consists of constituents of the MSCI Developed and Emerging Markets indices. Before 2001, we use the FTSE World Developed index for developed markets (going back to December 1985), and for emerging markets, the largest 800 constituents of the S&P Emerging BMI at the semi-annual index rebalance (going back to December 1995).
Value investing remains very attractive from a valuation perspective
In our view, this recent widening in multiples has several implications. First, diverging valuation multiples between cheap and expensive stocks are inconsistent with the concern that the value premium may have been arbitraged away as a result of it being so well known and due to substantial funds being invested in value strategies. Were this the case, it would be reflected in a narrowing valuation spread over time instead of the widening trend we have witnessed. Therefore, it is highly unlikely that arbitrage activity was the driver of the recent underperformance of value strategies.
Second, diverging valuation multiples suggest that return prospects for value are currently high. The widening of the valuation spread in the late 1990s was followed by mean reversion in the early 2000s, which resulted in the massive outperformance of cheap stocks over their expensive counterparts.
Third, the net spread widening that occurred over our full sample period means that realized returns might even underestimate the true magnitude of the value premium over this period.2
When we look at the recent developments in Figure 1, we do see that the value spread has shrunk slightly in 2021. However, it remains considerably wide compared to historical levels, still above the 97th percentile. Therefore, we believe that value investing remains very attractive from a valuation perspective.
One question that remains is that maybe ‘this time is indeed different’ and value stocks deserve to be cheaper than historically observed. Maybe expensive companies (based on simple valuation multiples) could be much more profitable today than in the past (compared to the dot-com bubble, for example), or their expected long-term growth could be much higher.
Figure 2 shows the spread in operating performance (proxied by gross profitability, GP/A)3 between cheap and expensive companies. On average, cheap stocks – according to the enhanced value strategy – display about the same levels of profitability as expensive ones, at a global level.4
Admittedly, cheap stocks have been less profitable between 2017 and 2020. However, their profitability has improved considerably in recent months. In fact, cheap stocks were actually slightly more profitable than their expensive peers at the end of March 2021. Therefore, the current valuation spread cannot be justified by differences in profitability.
Figure 2 | Spread in gross profitability for the enhanced value strategy
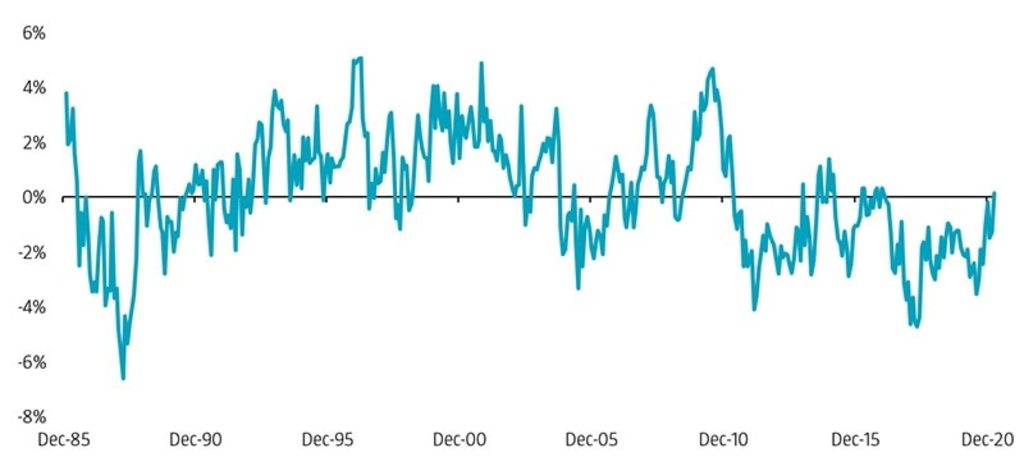
Source: Refinitiv. The figure shows the spread in gross profitability between the top and bottom quintile portfolios of an enhanced value strategy. The investment universe consists of constituents of the MSCI Developed and Emerging Markets indices. Before 2001, we use the FTSE World Developed index for developed markets (going back to December 1985), and for emerging markets, the largest 800 constituents of the S&P Emerging BMI at the semi-annual index rebalance (going back to December 1995).
Moreover, current profitability is mainly backward-looking, so what about future growth expectations? If profitability levels are the same as those in the present day, then stocks with higher expected growth should trade at higher valuations.
Cheap stocks tend to have lower future growth expectations than expensive ones, which explains why the latter are also called ‘growth stocks’. However, relative growth expectations are currently not lower than they have been in the previous 15 years, especially for developed markets. Thus, the widening of the value spread over the last three years cannot be traced back to a deterioration in growth expectations for value stocks.
Market sentiment for Value receives a shot in the arm
The recent value recovery has led to a change in sentiment regarding value stocks. Price momentum – measured as a stock’s return over the last 6 to 12 months – is one way to gauge market sentiment. While value and momentum tend to be negatively correlated – therefore providing diversification benefits – there have been a few periods in history when value stocks exhibited strong momentum. We expect this to happen again in the coming months.
Figure 3 depicts the difference between the median six-month performance of value and growth stocks. The difference has shifted from very negative to positive over the few last months. Since most momentum strategies use price momentum measures over 6 to 12 months and the value turnaround only started about six months ago, they have yet to purchase value stocks significantly. But one should expect them to start buying value stocks in a larger scale now that the market regime shift is clearly reflected in price momentum metrics.
Figure 3 | Spread in Momentum (6-0) for the enhanced value strategy
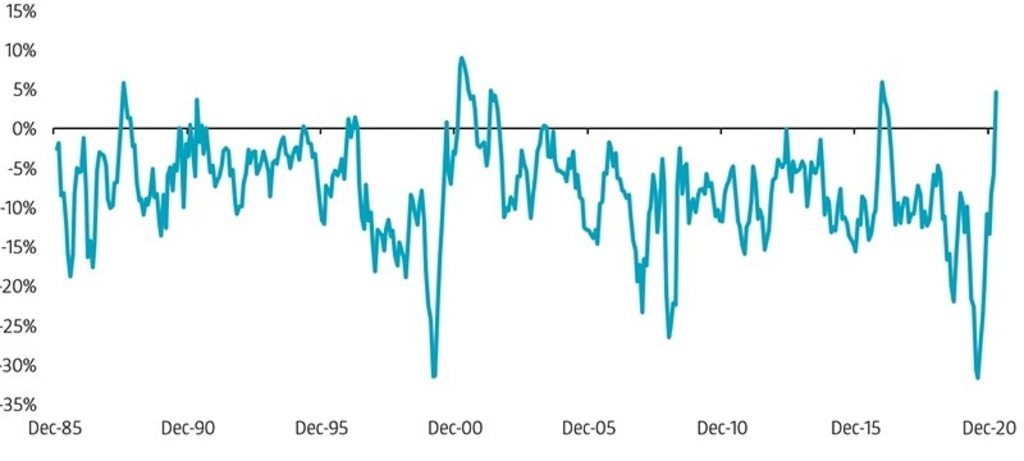
Source: Refinitiv. The figure shows the spread in 6-0 month price momentum between the top and bottom quintile portfolios of an enhanced value strategy. The investment universe consists of constituents of the MSCI Developed and Emerging Markets indices. Before 2001, we use the FTSE World Developed index for developed markets (going back to December 1985), and for emerging markets, the largest 800 constituents of the S&P Emerging BMI at the semi-annual index rebalance (going back to December 1995).
Current sentiment is in favor of value
Another way of measuring sentiment is to look at analyst earnings estimate revisions. Analysts tend to issue more upward than downward earnings revisions for expensive stocks than for cheap ones. However, over the last few months, analyst earnings per share (EPS) revisions for value stocks have been as optimistic as they have ever been in recent history. Although we still have to see if analyst earnings expectations will play out as forecasted, current sentiment is in favor of value.
All in all, after a long and harsh quant winter, spring has sprung and value seems ready for summer.
Footnotes
1 The enhanced value strategy is based on a composite of book-to-market (R&D adjusted), EBITDA/EV, CF/P, and NPY. Value stocks are sorted into quintile portfolios based on the valuation composite and in a region and sector respectively country neutral manner for developed and emerging markets. Quintile portfolios are equal-weighted and reformed monthly. The details of the enhanced value strategy are described in Blitz, D., and Hanauer, M., January 2021, “Resurrecting the Value Premium”, Journal of Portfolio Management.
2 Please see also the analysis in our paper ‘Resurrecting the Value Premium’.
3 GP/A is gross profit to assets.
4 The difference would be negative for a value strategy solely based on book-to-market. The difference is less pronounced or non-existent for the enhanced value strategy as it is based on a composite of value metrics that use profit measures such as EBITDA and cash flow in the numerator.
探索量化價值
訂閱我們的電子報,獲取尖端的量化策略和見解。
重要資料
本網站僅供《證券及期貨條例》(香港法例第571章)及其附屬法例所界定之專業投資者瀏覽及使用。 投資涉及風險。過往表現並不代表未來表現。本網站所載資料僅供參考之用,並不構成任何投資建議,亦非作出買賣任何證券或採納任何投資策略之要約或招攬。投資者不應僅憑本網站提供之資料作出投資決定,在作出任何投資決定前,應徵詢獨立意見(包括有關稅務影響之意見)。投資者應確保完全理解投資產品的相關風險,亦應考量自身投資目標及風險承受水平。投資乃閣下之個人決定。除非銷售投資產品的中介人已向閣下告知該投資產品適合閣下,並已解釋其符合閣下投資目標之原因,否則閣下不應投資。請參閱相關發售文件或其他法律文件,以獲取包括風險因素在內的進一步詳情。 本網站由荷寶投資管理香港有限公司發布,該公司受香港證券及期貨事務監察委員會(「證監會」)規管(中央編號:APU851)。本網站未經證監會審閱。 無法保證任何投資產品可實現其投資目標。概不就任何投資產品之表現或投資回報作任何聲明或承諾。投資的價值或會波動。本網站所載過往表現、推算或預測,均不應視作未來表現之保證或指標,且概不提供任何明示或暗示之保證。本網站內容建基於相信為可靠之來源,惟因應資料傳遞技術特性及須採用多項數據來源(包括第三方內容),故概不保證其準確性。所述觀點僅乃截至上述日期,或會隨市況變化而改變,可予更改而毋須另行通知。該等意見可能有別於其他荷寶投資專業人士之意見。因使用本材料或當中所載任何評論、意見或估算而引致之直接、間接或相應損失,荷寶概不承擔法律責任。荷寶並無責任更新本網站或任何網站內容。未經荷寶事先書面許可,不得複製、分發或刊發本網站任何材料。 除非另有說明,資料來源:荷寶。