Researcher


• 市場觀點
Using artificial intelligence for selecting small-cap stocks
Amid an ever-changing economic environment, small-cap equities present an equity sub-asset class that historically attracted flows in global large-cap market environments. In this insight of our special topic as part of our 5-year Expected Returns, our quant researchers Tobias Hoogteijling, Vera Roersma and Matthias Hanauer talk about how small caps are coming back into the spotlight.
作者


Researcher



Researcher
概要
- Small-cap indices represent a more diversified, cheaper universe
- Sparse analyst coverage means a fertile ground for quant
- AI and machine learning can offer alpha by capturing complex relationships
Small-cap stocks are publicly traded companies with market capitalizations typically ranging between USD 250 million and USD 10 billion.1 Small caps are an integral part of the global equity market portfolio, and many consider explicit allocation to them. “This is especially the case in today’s markets, where mega-cap tech stocks dominate large-cap indices, which also trade at elevated valuations,” says Hanauer. In contrast, small-cap indices comprise a much wider and more diversified mix of stocks, trading at a discount of approximately 20% compared to large caps.
The small-cap universe presents attractive alpha opportunities for investors who know where to find them, but also sizable challenges due to its broad and heterogeneous nature. Human analysts can only cover a limited number of names, and the more niche nature of small-cap firms makes specialization more difficult. 2
Sparse coverage means alpha opportunities
For example, on average, each small-cap stock is currently covered by about eight analysts, compared to 19 for large-cap stocks.3 Although fundamental managers might struggle to cover the investable small-cap universe, it fits naturally into a quantitative approach, as the cost of developing a quantitative model does not increase with the investable universe’s size. Conversely, as Roersma points out, quantitative strategies actually benefit from the universe’s breadth, from which they can systematically exploit a broad set of opportunities.
The small-cap universe’s size, diversity and complexity make it difficult for analysts and fundamental investors to cover it thoroughly. Its resulting market inefficiency and mispricing, however, can create larger opportunities to generate alpha. This greater degree of mispricing can be observed empirically, for example, by analyzing hypothetical top-minus-bottom portfolios based on well-known stock market factors such as value, momentum, and quality. Figure 1 illustrates that the annualized factor premiums and their corresponding volatilities are higher in the small-cap space than in the large-cap space.
Figure 1: Top-minus-bottom factor premiums in small-cap and large-cap space
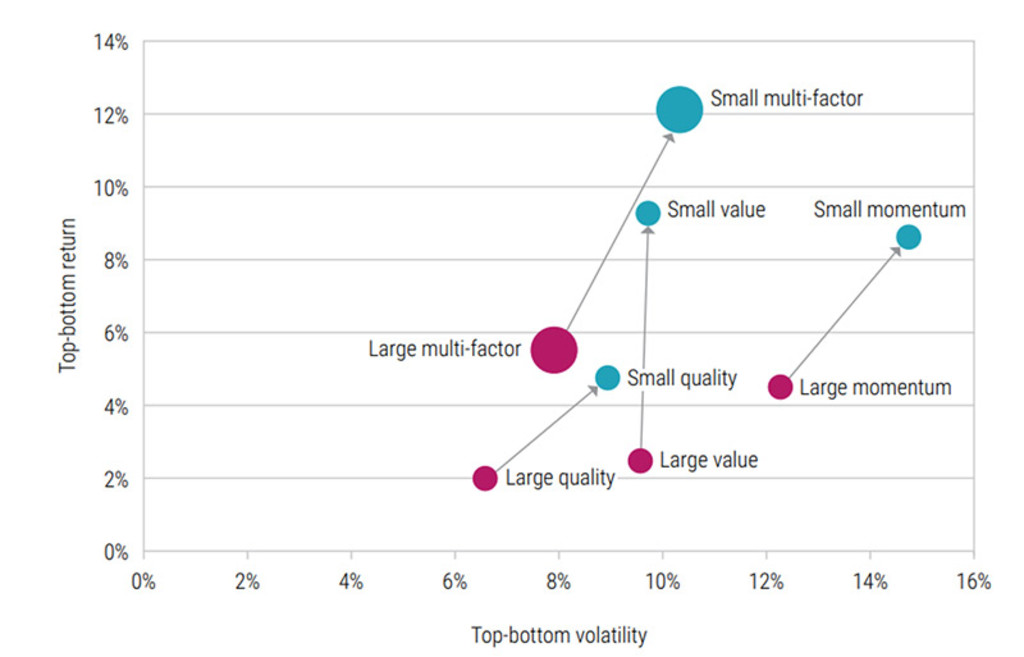
The performance shown is hypothetical, based on theoretical models and assumptions, and is no guarantee for future results. Source: Robeco. The graph reports the annualized returns and volatilities for ‘small’ and ‘large’ cap factors. Factor returns are the return spreads between the top and bottom factor quintile portfolios. Portfolios are equal-weighted and rebalanced monthly. The investment universe consists of the constituents of the MSCI World (‘large’) and MSCI World Small Cap (‘small’) indices. The generic factors are Value (book/price, forward earnings/price), Quality (ROE, debt/assets), and Momentum (12–1 month price momentum). The composite factor is an equally weighted average of Value, Momentum, and Quality. The sample period spans from January 2000 to April 2025.
Predicting stock returns with machine learning
To model such stock market dynamics, we turn to machine learning (ML), a subcategory of AI. In this specific case, says Hoogteijling, we are interested in modeling which stocks are likely to yield high returns (and thus are potential buy candidates) and vice versa. One key advantage of ML techniques is their flexibility in capturing data patterns. In a simpler, traditional approach, one would often assume that relationships are linear. However, not all real-life relationships can be linearly approximated. ML algorithms such as random forests and neural networks4 do not impose such a strict functional form, but instead can be more freely shaped depending on the data given to the model. 5
探索量化價值
訂閱我們的電子報,獲取尖端的量化策略和見解。
Performance of stock selection models
To assess the performance of these ML models – in other words, whether they can accurately predict whether stocks will outperform or underperform – we conduct a historical simulation study classifying the top and bottom half of stocks’ predicted returns. Then, we investigate to what extent the various models can correctly predict these two halves. If a model had no predictive power, about half of the stocks would be correctly predicted.
As illustrated in Figure 2, we find that both a generic factor model and an ML model outperform the ‘no predictability’ benchmark in terms of model accuracy. Furthermore, the ML model outperforms the generic value-quality-momentum factor model. Although stock-specific predictability of around 51-52% might seem low, small but consistent advantages can translate into long-term success. These stock-specific hit ratios translate into portfolio hit ratios of 68% and 78% for long-short quintile portfolios based on monthly returns, when sorted by generic and ML model predictions, respectively. These numbers highlight how even a slight improvement in predictive accuracy can lead to substantially better portfolio outcomes. 6
Figure 2: Average percentage of stocks accurately classified
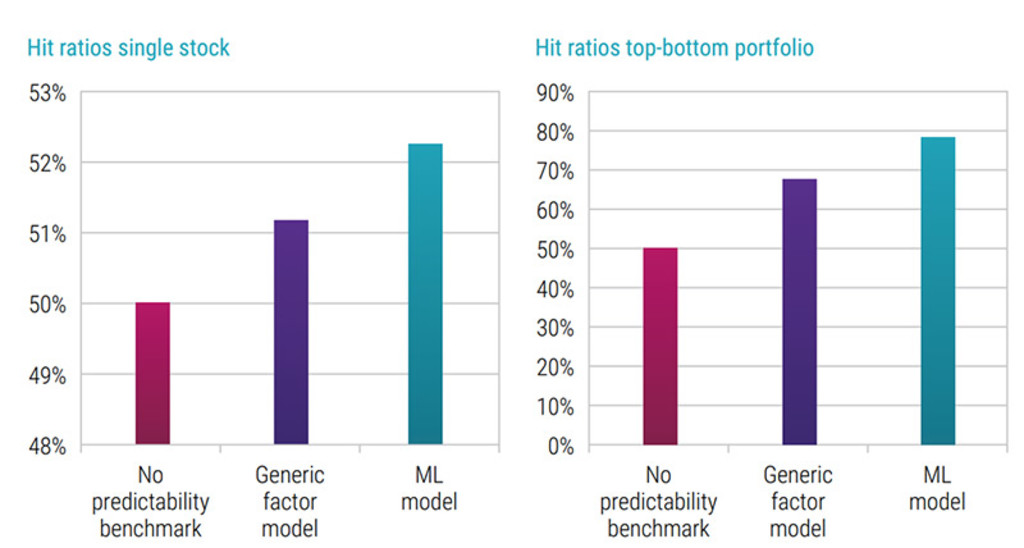
The performance shown is hypothetical, based on theoretical models and assumptions, and is no guarantee for future results. Source: Robeco. The figure on the left shows the time series’ average percentage of stocks correctly classified as being in the top half or bottom half of stocks in terms of next month returns, in a historical simulation study. The figure on the right shows the hit ratio of monthly long-short quantile portfolio returns, sorted based on predicted returns. The considered universes are the constituents of the MSCI World Small Cap Index over the period December 2000 to April 2025. The generic factor model consists of generic Value (book/price and forward earnings/price), Quality (ROE and debt/assets) and Momentum (12-1 month price momentum) factors.
Conclusion
In recent years, AI has shifted from hype to practical application, with machine learning in particular showing real promise for quantitative investing. Small-cap equities, with their breadth, inefficiencies, and limited coverage, offer especially fertile ground for these techniques.
Yet, as Hoogteijling explains, AI is not a silver bullet: success depends on careful model selection, interpretation, and explainability. When used with skill and discipline, however, machine learning can be a powerful addition to the quant investor’s toolkit, and a source of enduring edge in small-cap markets.
This article is an excerpt of a special topic in our five-year outlook.
Footnotes
1 As of the end of April 2025, based on the market capitalization numbers for the constituents of the MSCI World Small Cap Index, winsorized at the top and bottom 2.5%.
2 As of the end of April 2025, based on four bottom-up-calculated multiples (price-to-book, forward price-to-earnings, price-to-earnings, and price-to-dividend) for the MSCI World and MSCI World Small Cap indices.
3 Source: IBES.
4 A neural network is a type of ML model that learns to recognize patterns, inspired by how the human brain processes information. A random forest is a group of simple decision-making models (called decision trees) that work together to make more accurate choices than just one tree on its own.
5 For a broader view of the different applications of ML in asset management, we refer to Blitz et al. (2023) and Chen and Zhou (2023).
6 The performance shown is hypothetical, based on theoretical models and assumptions, and is no guarantee for future results.

Expected Returns 2026 - 2030
重要資料
本網站僅供《證券及期貨條例》(香港法例第571章)及其附屬法例所界定之專業投資者瀏覽及使用。 投資涉及風險。過往表現並不代表未來表現。本網站所載資料僅供參考之用,並不構成任何投資建議,亦非作出買賣任何證券或採納任何投資策略之要約或招攬。投資者不應僅憑本網站提供之資料作出投資決定,在作出任何投資決定前,應徵詢獨立意見(包括有關稅務影響之意見)。投資者應確保完全理解投資產品的相關風險,亦應考量自身投資目標及風險承受水平。投資乃閣下之個人決定。除非銷售投資產品的中介人已向閣下告知該投資產品適合閣下,並已解釋其符合閣下投資目標之原因,否則閣下不應投資。請參閱相關發售文件或其他法律文件,以獲取包括風險因素在內的進一步詳情。 本網站由荷寶投資管理香港有限公司發布,該公司受香港證券及期貨事務監察委員會(「證監會」)規管(中央編號:APU851)。本網站未經證監會審閱。 無法保證任何投資產品可實現其投資目標。概不就任何投資產品之表現或投資回報作任何聲明或承諾。投資的價值或會波動。本網站所載過往表現、推算或預測,均不應視作未來表現之保證或指標,且概不提供任何明示或暗示之保證。本網站內容建基於相信為可靠之來源,惟因應資料傳遞技術特性及須採用多項數據來源(包括第三方內容),故概不保證其準確性。所述觀點僅乃截至上述日期,或會隨市況變化而改變,可予更改而毋須另行通知。該等意見可能有別於其他荷寶投資專業人士之意見。因使用本材料或當中所載任何評論、意見或估算而引致之直接、間接或相應損失,荷寶概不承擔法律責任。荷寶並無責任更新本網站或任何網站內容。未經荷寶事先書面許可,不得複製、分發或刊發本網站任何材料。 除非另有說明,資料來源:荷寶。