
Head of Conservative Equities and Chief Quant Strategist


• インサイト
Quant chart: Rethinking risk – what bond drawdowns reveal
Even traditionally ‘safe’ assets like government bonds haven’t protected real wealth this century. Understanding their drawdown behavior sheds light on risk in multi-asset portfolios.
Every asset class, including savings, bonds, stocks, and even gold, has episodes where real purchasing power was eroded deeply. In his blog ‘No asset is safe – but some lose less’, Pim van Vliet takes a larger historical perspective, emphasizing that it’s not the absence of risk but the different shapes of risk that matter..
In this quant chart, we focus on the modern ‘bond winter’ as the latest chapter in that story, where inflation and rate cycles collide to produce real losses for fixed income investors. Examining the deeply held belief that bonds are a reliable hedge against loss, the chart offers a close up of how real drawdowns1 have shaped the experience of long-term bond holders, as well as touching upon the Total Portfolio Approach.
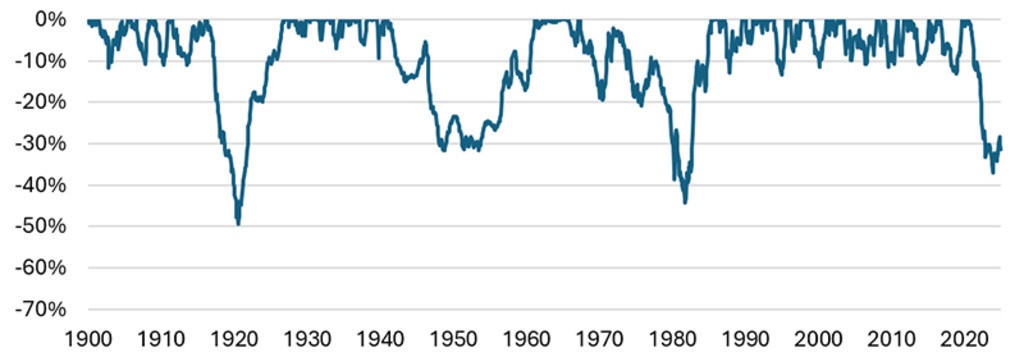
The chart captures the peak-to-trough real drawdowns in US government bonds over an extended period, essentially answering the question: ‘If I had bought bonds at the worst possible moment, how far would I have fallen, after accounting for inflation?’
Figure 1 – Real drawdowns US government bonds, 1900-2025
Source: McQuarrie (2024)2 and Robeco
While government bonds are often seen as safe, their real drawdown history tells a more nuanced story. In periods where inflation rises sharply and interest rates adjust upward, bond prices can fall while inflation simultaneously erodes value: a double hit for investors.
The 1970s and early 1980s stand out as a severe example, with real losses approaching 50%. But the experience of the early 2020s shows this is not just ancient history. Even recently, bond investors faced real drawdowns of around 30%, challenging the idea that bonds reliably protect wealth in all environments.
The key insight is not that bonds are inherently unsafe, but that nominal stability over short horizons does not guarantee real safety over long horizons. Risk that looks benign at a one-month frequency can accumulate quietly and painfully when inflation persists.
A more nuanced narrative
This horizon-dependent view of risk sits at the heart of the increasingly discussed Total Portfolio Approach. Rather than assigning assets to rigid ‘safe’ or ‘risky’ buckets, it focuses on how the entire portfolio behaves across economic regimes and over long investment horizons, with particular attention to downside risk in real terms.
From that perspective, bonds are not always the low-risk anchor they are often assumed to be. Conversely, equities, especially defensive equities, can look less risky than commonly believed when evaluated on long-term real drawdowns rather than short-term volatility. While equities are more volatile month to month, low-risk stocks have historically exhibited real drawdown profiles that are not dramatically worse than those of bonds, while offering better participation in economic growth and inflation adjustment over time.
Real losses impair recovery in a way nominal returns often obscure: a 30% loss in purchasing power requires more than a 40% gain just to break even. This asymmetry matters for long-horizon investors. Bond drawdowns illustrate that portfolio risk is not symmetric across asset classes. While equities may be volatile, they tend to grow with inflation over time, whereas bonds can be caught flat-footed when rising yields and inflation erode real value simultaneously.
A total portfolio perspective naturally accommodates thinking beyond traditional risk buckets and incorporates real return perspectives, especially in environments with elevated inflation and rate volatility. As Van Vliet notes in the full blog, diversification remains a key defense. Putting all your capital in a savings account increases long-term inflation risk. Putting everything in equities increases both short- and long-term drawdowns. A steady portfolio, including, for example, a meaningful allocation to low volatility, conservative equities, can offer a compelling combination of inflation protection, market stability, and long-term return.
Footnotes
1Real drawdowns here refers to declines in purchasing power after inflation.
2McQuarrie, E.F. (2024b) ‘Introducing a New Monthly Series of US Government Bond Returns 1793–2023’. working paper 4899187, SSRN
最新のインサイトを受け取る
投資に関する最新情報や専門家の分析を盛り込んだニュースレター(英文)を定期的にお届けします。
重要事項
当資料は情報提供を目的として、ロベコ・ジャパン株式会社(以下「当社」)が独自に作成、または当社のグループ会社(Robeco Institutional Asset Management B.V.およびその関連会社を含む)から提供された資料を当社が編集・翻訳したものです。資料中の個別の金融商品の売買の勧誘や推奨等を目的とするものではありません。記載された情報は十分信頼できるものであると考えておりますが、その正確性、完全性を保証するものではありません。意見や見通しはあくまで作成日における弊社の判断に基づくものであり、今後予告なしに変更されることがあります。運用状況、市場動向、意見等は、過去の一時点あるいは過去の一定期間についてのものであり、過去の実績は将来の運用成果を保証または示唆するものではありません。また、記載された投資方針・戦略等は全ての投資家の皆様に適合するとは限りません。当資料は法律、税務、会計面での助言の提供を意図するものではありません。 ご契約に際しては、必要に応じ専門家にご相談の上、最終的なご判断はお客様ご自身でなさるようお願い致します。 運用を行う資産の評価額は、組入有価証券等の価格、金融市場の相場や金利等の変動、及び組入有価証券の発行体の財務状況による信用力等の影響を受けて変動します。また、外貨建資産に投資する場合は為替変動の影響も受けます。運用によって生じた損益は、全て投資家の皆様に帰属します。したがって投資元本や一定の運用成果が保証されているものではなく、投資元本を上回る損失を被ることがあります。弊社が行う金融商品取引業に係る手数料または報酬は、締結される契約の種類や契約資産額により異なるため、当資料において記載せず別途ご提示させて頂く場合があります。具体的な手数料または報酬の金額・計算方法につきましては弊社担当者へお問合せください。 当資料及び記載されている情報、商品に関する権利は弊社に帰属します。したがって、弊社の書面による同意なくしてその全部もしくは一部を複製またはその他の方法で配布することはご遠慮ください。 商号等: ロベコ・ジャパン株式会社 金融商品取引業者 関東財務局長(金商)第2780号 加入協会: 一般社団法人 資産運用業協会