Portfolio Manager
新興国がもたらす機会とは?
新興国の投資機会を深掘りするニュースレター(英文)に登録しましょう。






High yields, shifting capital flows, and structural tailwinds are putting emerging market debt back on the agenda. But should investors favor local or hard currency bonds in the search for income and resilience?




Emerging markets are back in focus, outperforming developed markets and increasingly benefiting from structural shifts in the global economy. This has renewed interest in EM debt: local currency bonds have been buoyed by high carry and a weaker dollar, while hard currency debt has drawn flows with high yields and strong fundamentals.
Robeco’s five-year expected returns suggest the attractiveness of EMD is not just cyclical but structural, with projected long-term base case returns of 6.25% for local currency and 4.50% for hard currency EMD annually – levels that surpass those of other fixed income asset classes.1 Yet emerging market debt is far from straightforward, each moving to different global and local rhythms of rates, spreads and FX.
So, what should investors choose?
We staged a mock ‘battle of perspectives’ between our local currency Portfolio Manager, Richard Briggs (RB) and our hard currency Portfolio Managers Nicholas Sauer (NS), asking them how they would respond to a series of real-world scenarios.
RB: In a dollar weakening cycle, local EMD tends to be strongly supported because the asset class is highly FX-focused and the dollar is the main driver. A global growth slowdown can also be positive for local markets, as it pushes central banks toward easing, which supports local bond returns.
Carry remains significant in local currency debt. While it can be eroded by FX weakness, in the current environment of either a stable or weaker dollar, investors can capture both carry and spot FX returns. Longer term, the dollar still looks overvalued: even with this year’s weakness, it remains much stronger than in the early 2010s, suggesting scope for further depreciation.
Ultimately, the key drivers for EM FX are financial flows and trade flows. While trade tensions remain an issue, signs of reallocation away from US assets suggest a supportive environment for local EMD.
NS: The current environment is conducive for EM hard currency returns. A slowing US economy is usually associated with the Fed cutting rates, and because EM hard currency bonds are denominated in US dollars, they trade off the US yield curve and benefit directly when US yields move lower.
While a weaker dollar does not impact dollar-denominated assets directly, it does improve EM fundamentals, which in turn supports tighter spreads – another positive for EM hard currency returns. Yields are also attractive: at around 7.7%, they sit in the 76th percentile historically. That income provides solid support for expected returns, with additional upside possible if spreads tighten further or US yields decline further.
新興国の投資機会を深掘りするニュースレター(英文)に登録しましょう。
RB: Local currency markets can experience drawdowns, but one of their key advantages is liquidity. Even in times of stress, local government bond markets typically remain open and tradeable, with local banks providing liquidity. That makes it easier for investors to transact compared to some credit markets, where liquidity can dry up.
Another benefit is diversification. Local bonds are less correlated with other fixed income assets because of their FX component, providing exposure across multiple regions and currencies rather than just the US dollar. While risk-adjusted returns in local have looked weaker over a longer period, that has created room for a rebound – and indeed, this year local currency debt has been one of the best-performing global asset classes. For investors seeking diversification and consistent liquidity, local bonds can play a vital role, especially when other fixed income asset classes face challenges.
NS: For a client prioritizing easy exit and low drawdowns, hard currency EM debt offers a strong case. Default risk in EM is currently limited: we have just come through a cycle of sovereign stress, and balance sheets are now much cleaner and stronger both historically and relative to DM.
On the volatility side, hard currency bonds have historically been far more stable than local currency. This is because spreads and yields in hard currency bonds tend to be negatively correlated, which helps keep overall yields relatively steady. Today’s yield of around 8% also provides a meaningful cushion: with that level of income and an average duration of seven years, the asset class can absorb a rise of more than 1% in yields before returns turn negative. All told, hard currency screens well for investors seeking lower volatility, solid risk-adjusted returns, and reliable liquidity.
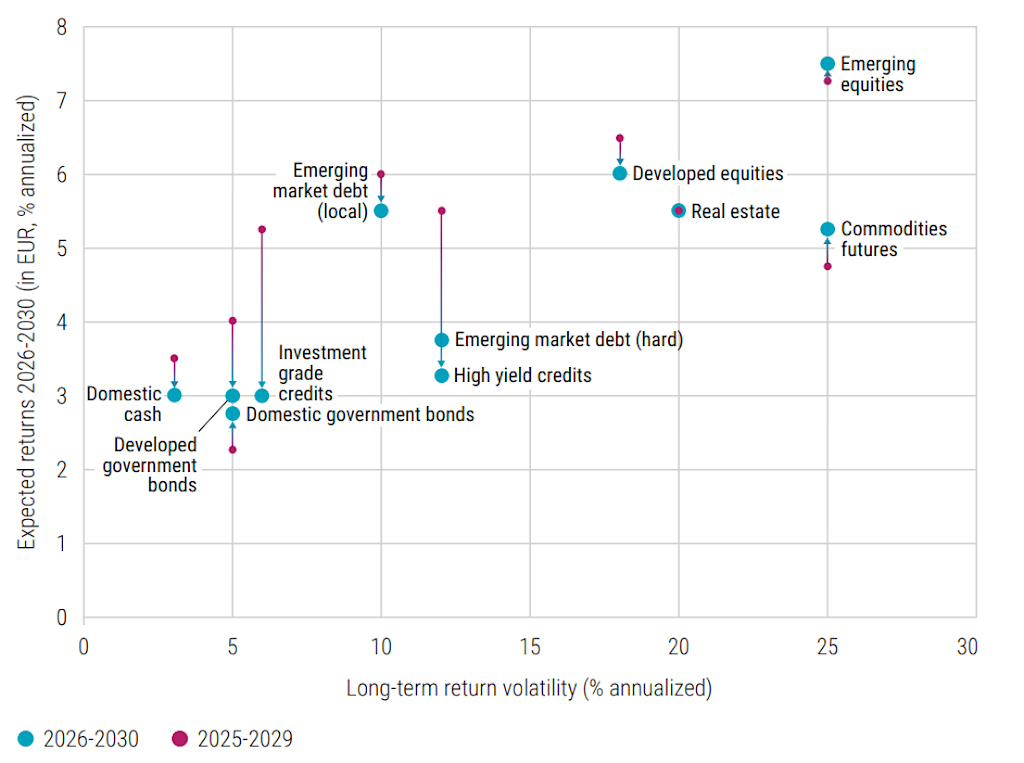
Capital at risk: Returns are geometric and annualized. The scenarios presented are not an exact indicator. They are an estimate of future performance based on current market conditions and evidence from the past on how the value of this investment varies. Expected returns will vary dependent on market performance.
Source: Robeco. September 2025. Vertical axis shows the expected geometric annualized returns for a euro investor over 2026-2030 and 2025-2029. The horizontal axis is a proxy for the long-term volatility of each asset class.
RB: For investors reducing US exposure, local currency EMD offers several angles. Compared to EM equities, local debt provides FX exposure but with typically smaller drawdowns, as bonds tend to outperform in slower growth environments. The country mix also differs as local benchmarks have much less China exposure than EM equity indices, which improves diversification.
For investors moving out of US investment grade credit, EM local bonds offer useful duration exposure with different dynamics than hard currency debt. They can outperform in certain rate environments, while also providing diversification benefits for those reallocating from high yield, as local markets are less correlated with global credit.
NS: Hard currency behaves like a credit asset class, correlating more closely with US and European IG and HY markets. For investors wanting a more straightforward fixed income exposure, with generally lower volatility and default risk, hard currency is the natural fit. Yields remain attractive, and with cleaner EM balance sheets after the recent default cycle, the fundamental risk profile of hard currency looks much improved. For many fixed income allocators, hard currency provides the most direct and comparable alternative to US credit.
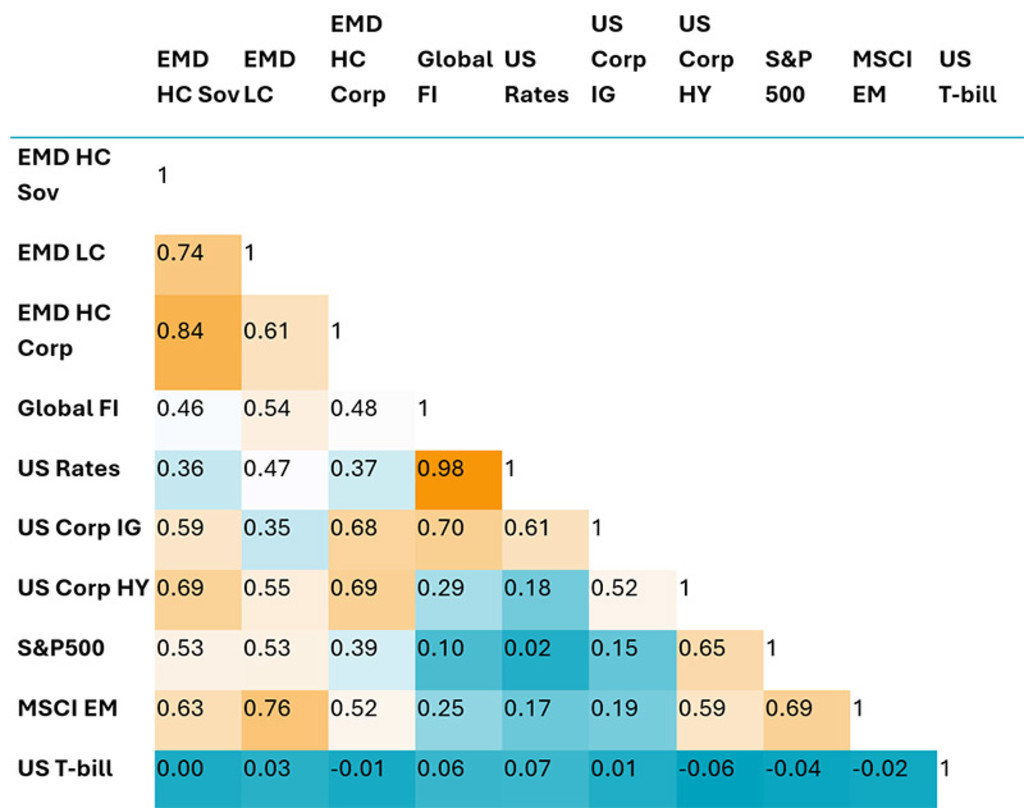
Source: Bloomberg, J.P. Morgan, MSCI, S&P, Robeco. EMD HC Sov: JPM EMBI Global Diversified Index, EMD LC: JPM GBI-EM Global Diversified Index, EMD HC Corp: JPM CEMBI Index, Global FI: Bloomberg Global Aggregate Index, US Rates: Bloomberg Global Aggregate - Treasuries Index, US Corp IG: Bloomberg US Corporate Bond Index, US Corp HY: Bloomberg US Corporate High Yield Bond Index, MSCI EM: MSCI Emerging Markets, US T-bill: Bloomberg US Treasury Bills: 1-3 Months Index. April 2025.
RB: Most recent flows into local EMD have gone into passive ETFs, but the performance gap is telling. ETFs have generally underperformed active funds, even against the weaker quartile of managers. The reason is simple, the local universe is extremely diverse. You have countries like China yielding 1.5%, Brazil around 13–14%, and Turkey in the 30s. An active manager can actively manage those exposures dynamically depending on both local and global macro factors.
Active funds also have more tools at their disposal: separating FX from bond exposure, using forwards and swaps to adjust hedges, or positioning along different parts of the curve. Importantly, active managers can access frontier markets that are not in the benchmark, places like Egypt or Nigeria which are often uncorrelated and carry-rich. While riskier, these positions can significantly enhance returns if carefully selected, and passive ETFs simply don’t take this into account.
NS: In hard currency, passive ETFs also tend to underperform. They closely track benchmarks but almost always with a small drag, so they end up delivering slightly worse risk/return. On top of that, ETFs often use modified benchmarks with higher minimum bond sizes to ensure liquidity, which means smaller, higher-yielding issues are excluded. That not only reduces potential return but can also increase volatility.
Active management can do much more like select corporate bonds, access frontier sovereigns, and exploit relative value opportunities outside the index. Historically, this has meant that passive hard currency strategies show Sharpe ratios around 20% lower than active. The main reason flows have gone to ETFs is convenience – it’s easier for allocators to buy something simple and liquid with low tracking error. But for anyone looking for genuine performance and risk-adjusted returns, active hard currency strategies offer far more.
1See table 5.5, page 122: 5-year Expected Returns: The Stale Renaissance
当資料は情報提供を目的として、ロベコ・ジャパン株式会社(以下「当社」)が独自に作成、または当社のグループ会社(Robeco Institutional Asset Management B.V.およびその関連会社を含む)から提供された資料を当社が編集・翻訳したものです。資料中の個別の金融商品の売買の勧誘や推奨等を目的とするものではありません。記載された情報は十分信頼できるものであると考えておりますが、その正確性、完全性を保証するものではありません。意見や見通しはあくまで作成日における弊社の判断に基づくものであり、今後予告なしに変更されることがあります。運用状況、市場動向、意見等は、過去の一時点あるいは過去の一定期間についてのものであり、過去の実績は将来の運用成果を保証または示唆するものではありません。また、記載された投資方針・戦略等は全ての投資家の皆様に適合するとは限りません。当資料は法律、税務、会計面での助言の提供を意図するものではありません。 ご契約に際しては、必要に応じ専門家にご相談の上、最終的なご判断はお客様ご自身でなさるようお願い致します。 運用を行う資産の評価額は、組入有価証券等の価格、金融市場の相場や金利等の変動、及び組入有価証券の発行体の財務状況による信用力等の影響を受けて変動します。また、外貨建資産に投資する場合は為替変動の影響も受けます。運用によって生じた損益は、全て投資家の皆様に帰属します。したがって投資元本や一定の運用成果が保証されているものではなく、投資元本を上回る損失を被ることがあります。弊社が行う金融商品取引業に係る手数料または報酬は、締結される契約の種類や契約資産額により異なるため、当資料において記載せず別途ご提示させて頂く場合があります。具体的な手数料または報酬の金額・計算方法につきましては弊社担当者へお問合せください。 当資料及び記載されている情報、商品に関する権利は弊社に帰属します。したがって、弊社の書面による同意なくしてその全部もしくは一部を複製またはその他の方法で配布することはご遠慮ください。 商号等: ロベコ・ジャパン株式会社 金融商品取引業者 関東財務局長(金商)第2780号 加入協会: 一般社団法人 資産運用業協会
重要なお知らせ 当社や当社役職員を装ったSNSアカウントやウェブサイト等を使った投資勧誘にご注意ください さらに表示