16:00 CET
Multi-Asset: A crude ceasefire
By Peter van der Welle, Multi-Asset Strategist
After a turbulent week, which saw US president Trump putting unprecedented verbal pressure on the Iranian regime, a ceasefire has been shaping up. Yet, Iran remains firmly in control of the escalation dynamic. Only a few ships are reported to have passed through the Strait of Hormuz since the ceasefire took effect at 8 PM Eastern time on 8 April. The effective closure of the Strait of Hormuz still leaves a supply loss of an estimated 8 mb/d of supply, creating a material mismatch between what strategic oil reserve releases can realistically offset and what is being lost in transit. Even optimistic assumptions around reserve releases and Saudi rerouting via Yanbu (around 7 mb/d) only cover a fraction of the usual Hormuz flows (around 15 mb/d, amounting to roughly 15% of global supply).
Forward oil futures curves are in steep backwardation, implying the oil market is still expecting the duration of this conflict to be short with spot prices significantly above longer-dated futures prices. Whereas Dated Brent for immediate delivery trades at USD 126 p/b, the Dec ‘26 contract trades at USD 80 p/b.
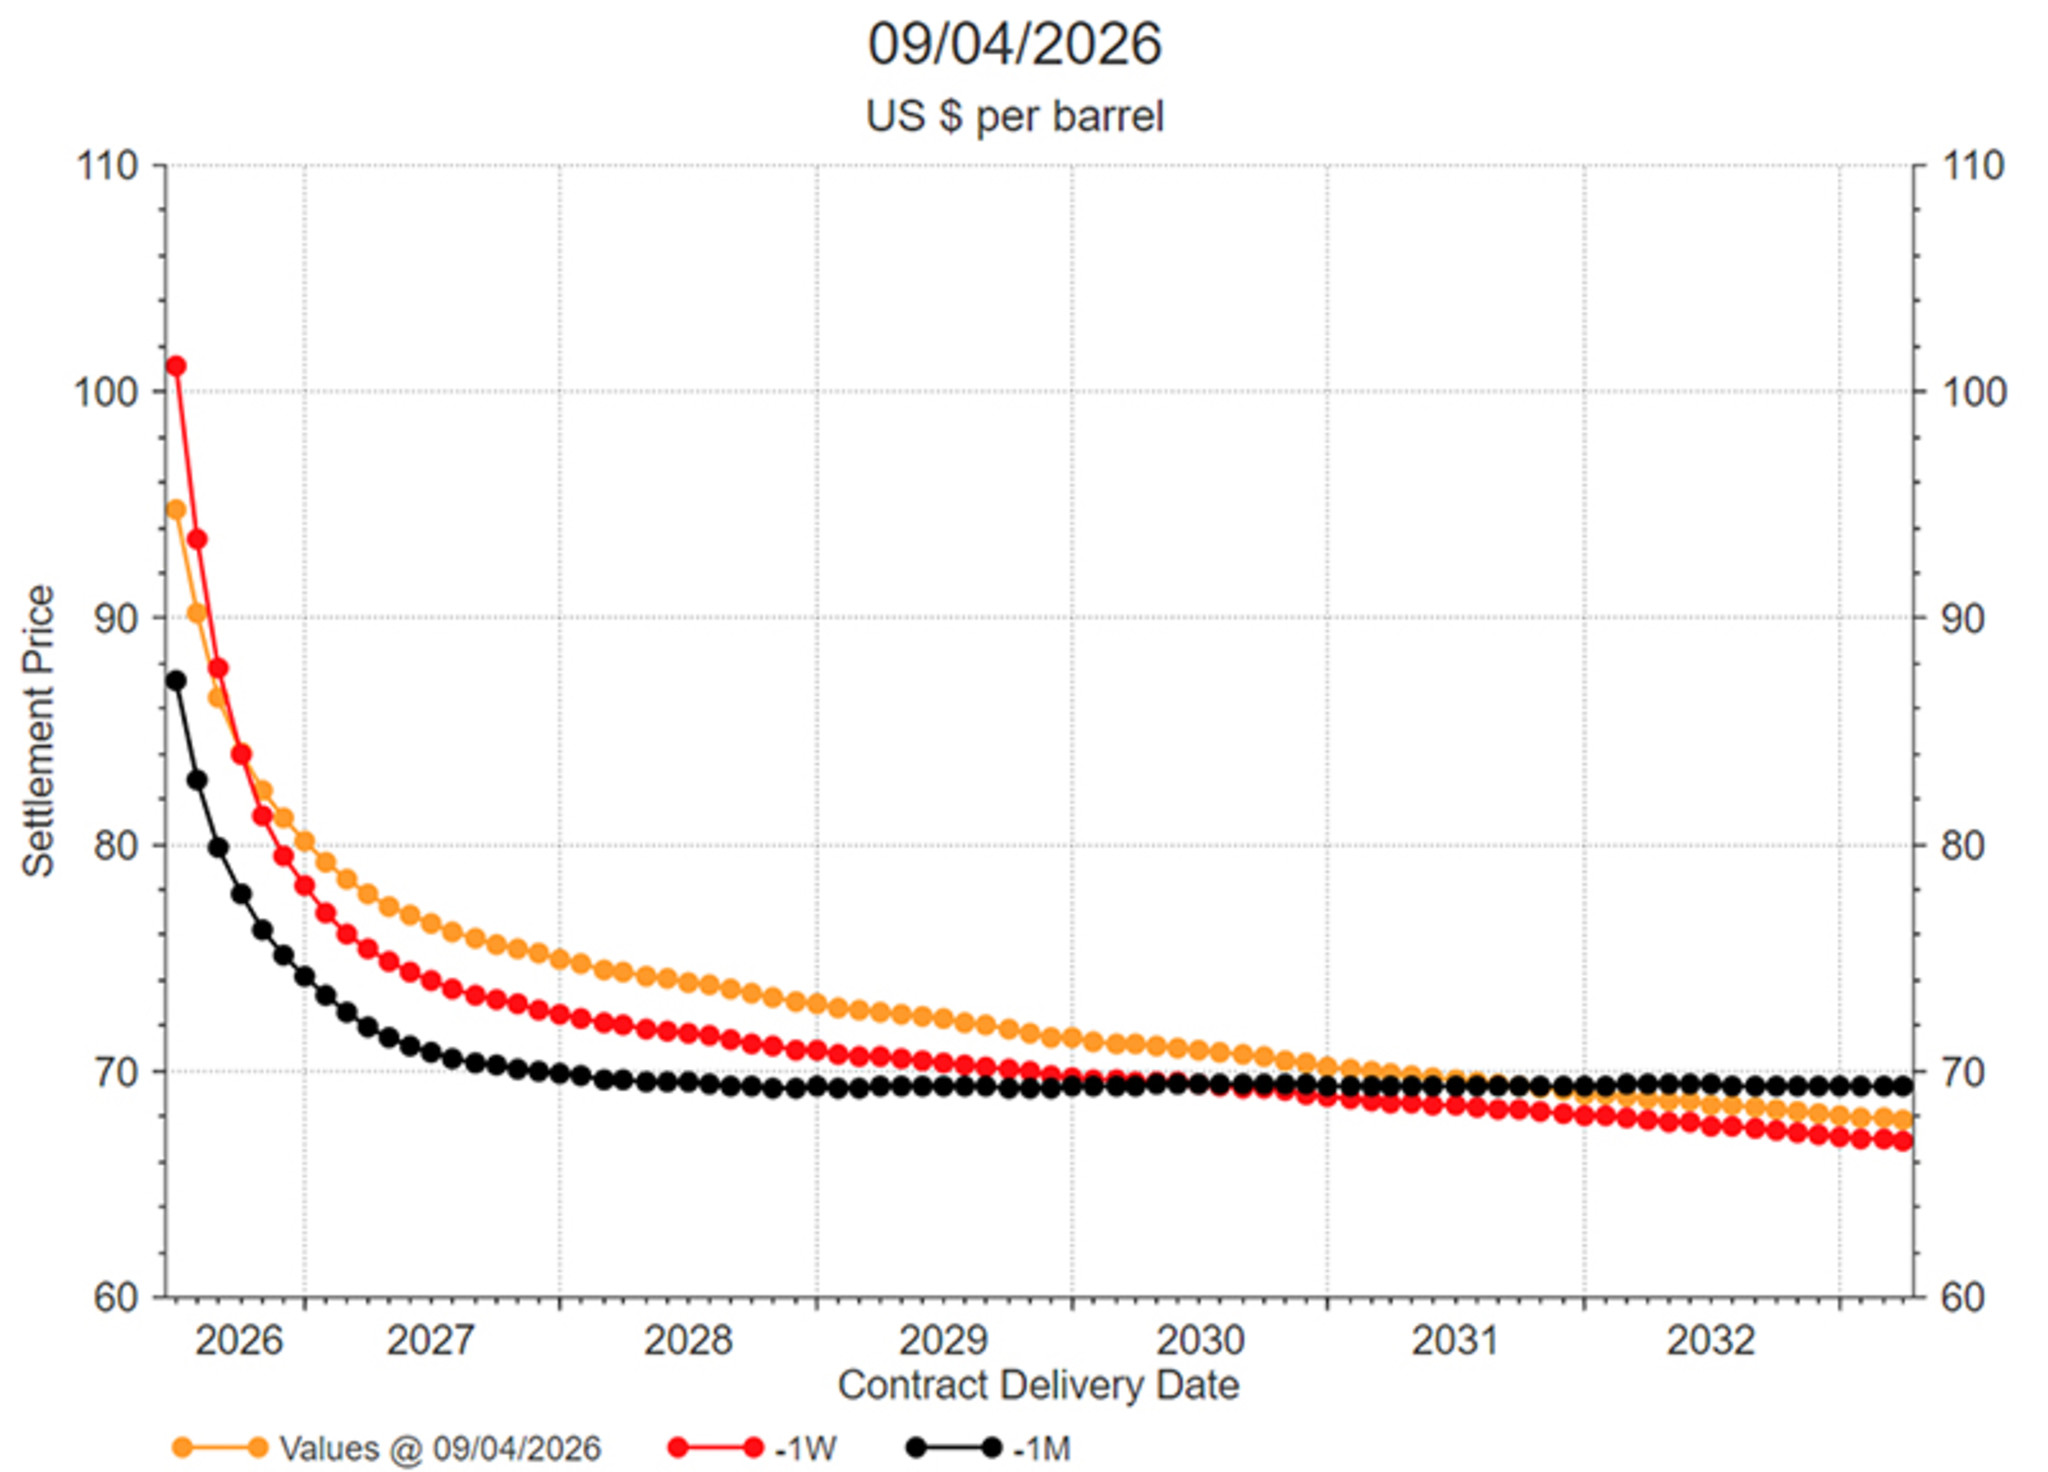
Source: LSEG Datastream, Robeco
With the ceasefire, we are likely past peak policy uncertainty
The fact that a ceasefire has been established for the next two weeks has clearly moved probability mass from uncontrolled escalation toward less bearish scenario outcomes (see our ‘Scenario probability’ pie chart). This meaningful reduction in downside risk is the signal the market had been waiting for. Markets really want to move on from this conflict. Equities tend to rally after peak policy uncertainty and President Trump's apocalyptic sounding threats toward Iran last week likely epitomized peak policy uncertainty for this conflict.
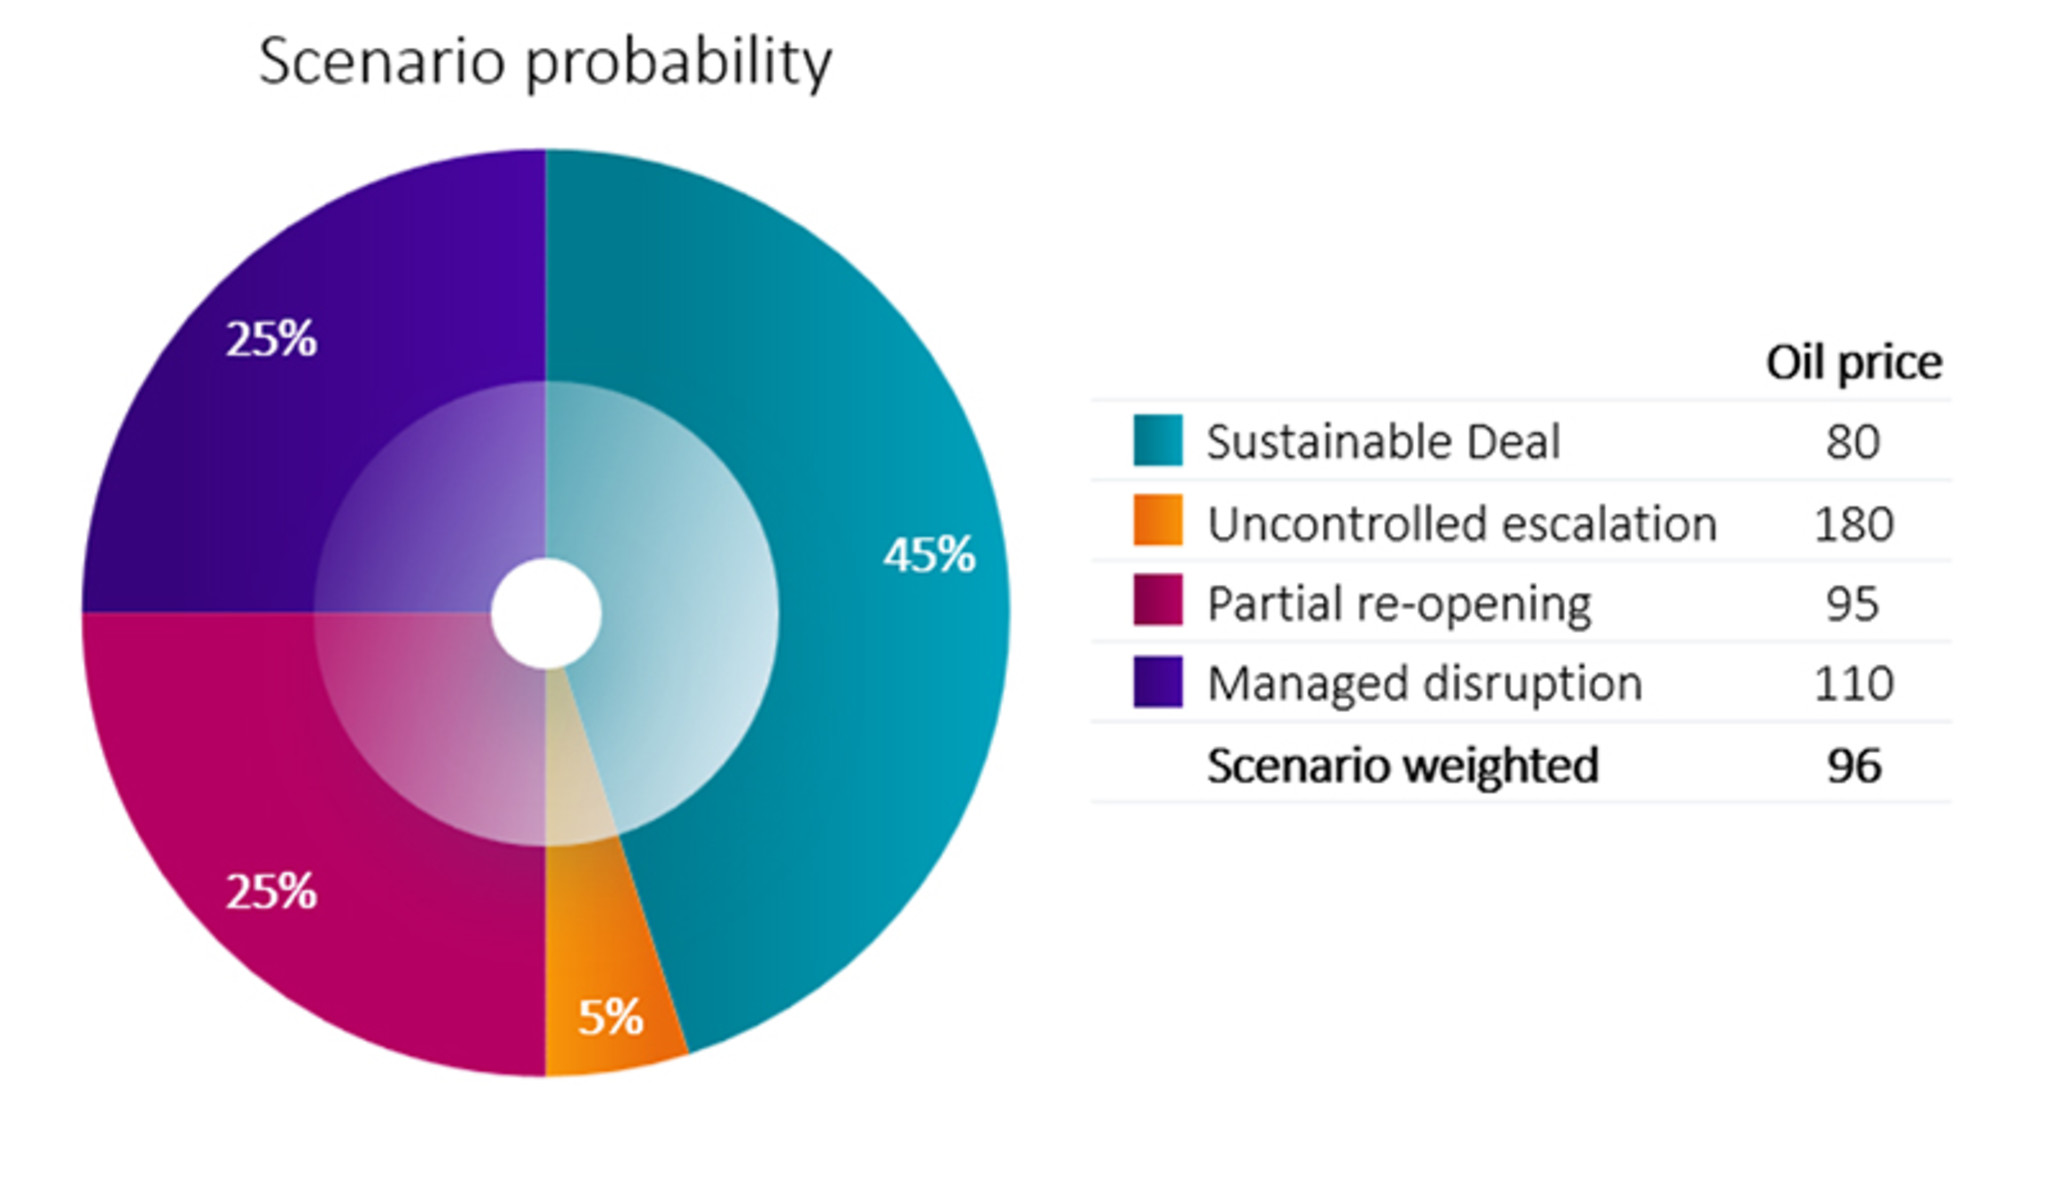
Source: Robeco, April 2026.
While markets have been underreacting relative to the prevailing level of geopolitical risk, the implied volatility of the S&P 500, an important risk barometer, did exceed 30 on an intraday basis last week. From an asset market perspective, history suggests that VIX spikes above 30 tend to deliver strong 3-12 month equity returns.
This creates a tension between near term downside risks from energy driven stagflation and the historically high hit rate for positive equity returns after volatility shocks. As long as inflation remains below 4%, we typically are still in the sweet spot for equities. A durable rally likely requires easing geopolitical risk (a sustained, albeit partial re-opening of the Strait of Hormuz) alongside confirmation that second round inflation effects remain contained, allowing central banks to look through the initial headline inflation spike.
Yet, still navigating the fog of war
The market optimism about an expected decline in oil prices over the course of the next months could be challenged. Looking at historical price patterns following negative supply shocks in the oil market, we find that oil prices tend to trend lower only after the 100-150-day window since the start of a conflict. We are now 41 days into this conflict at the time of writing. From the geopolitical literature we also know that ceasefires only end up in settlements in 15-25% of the cases (see Clayton et al. 2022, Journal of Conflict Resolution). While a tail risk in our scenario set, uncontrolled escalation remains a real possibility. Iran has control of a major chokepoint and time is on the side of the Iranians with a US president facing midterm elections. Maximizing its leverage over the Strait of Hormuz enables Iran to get the best deal for the 10-point plan it has issued as a template for negotiations in Islamabad in the coming weeks. But this is also a high-risk strategy with US troop numbers only increasing in the Middle East in the coming weeks, as new US navy ships are planned to arrive in the Gulf. Thus, a persisting threat for shipping would leave room for higher risk premiums in oil prices. In our uncontrolled escalation scenario we see Brent prices at USD 180 p/b. This level would correspond with the +1 STD deviation from the average oil price peak observed in previous negative supply shocks. Oil shippers and investors alike have to navigate the fog of war.
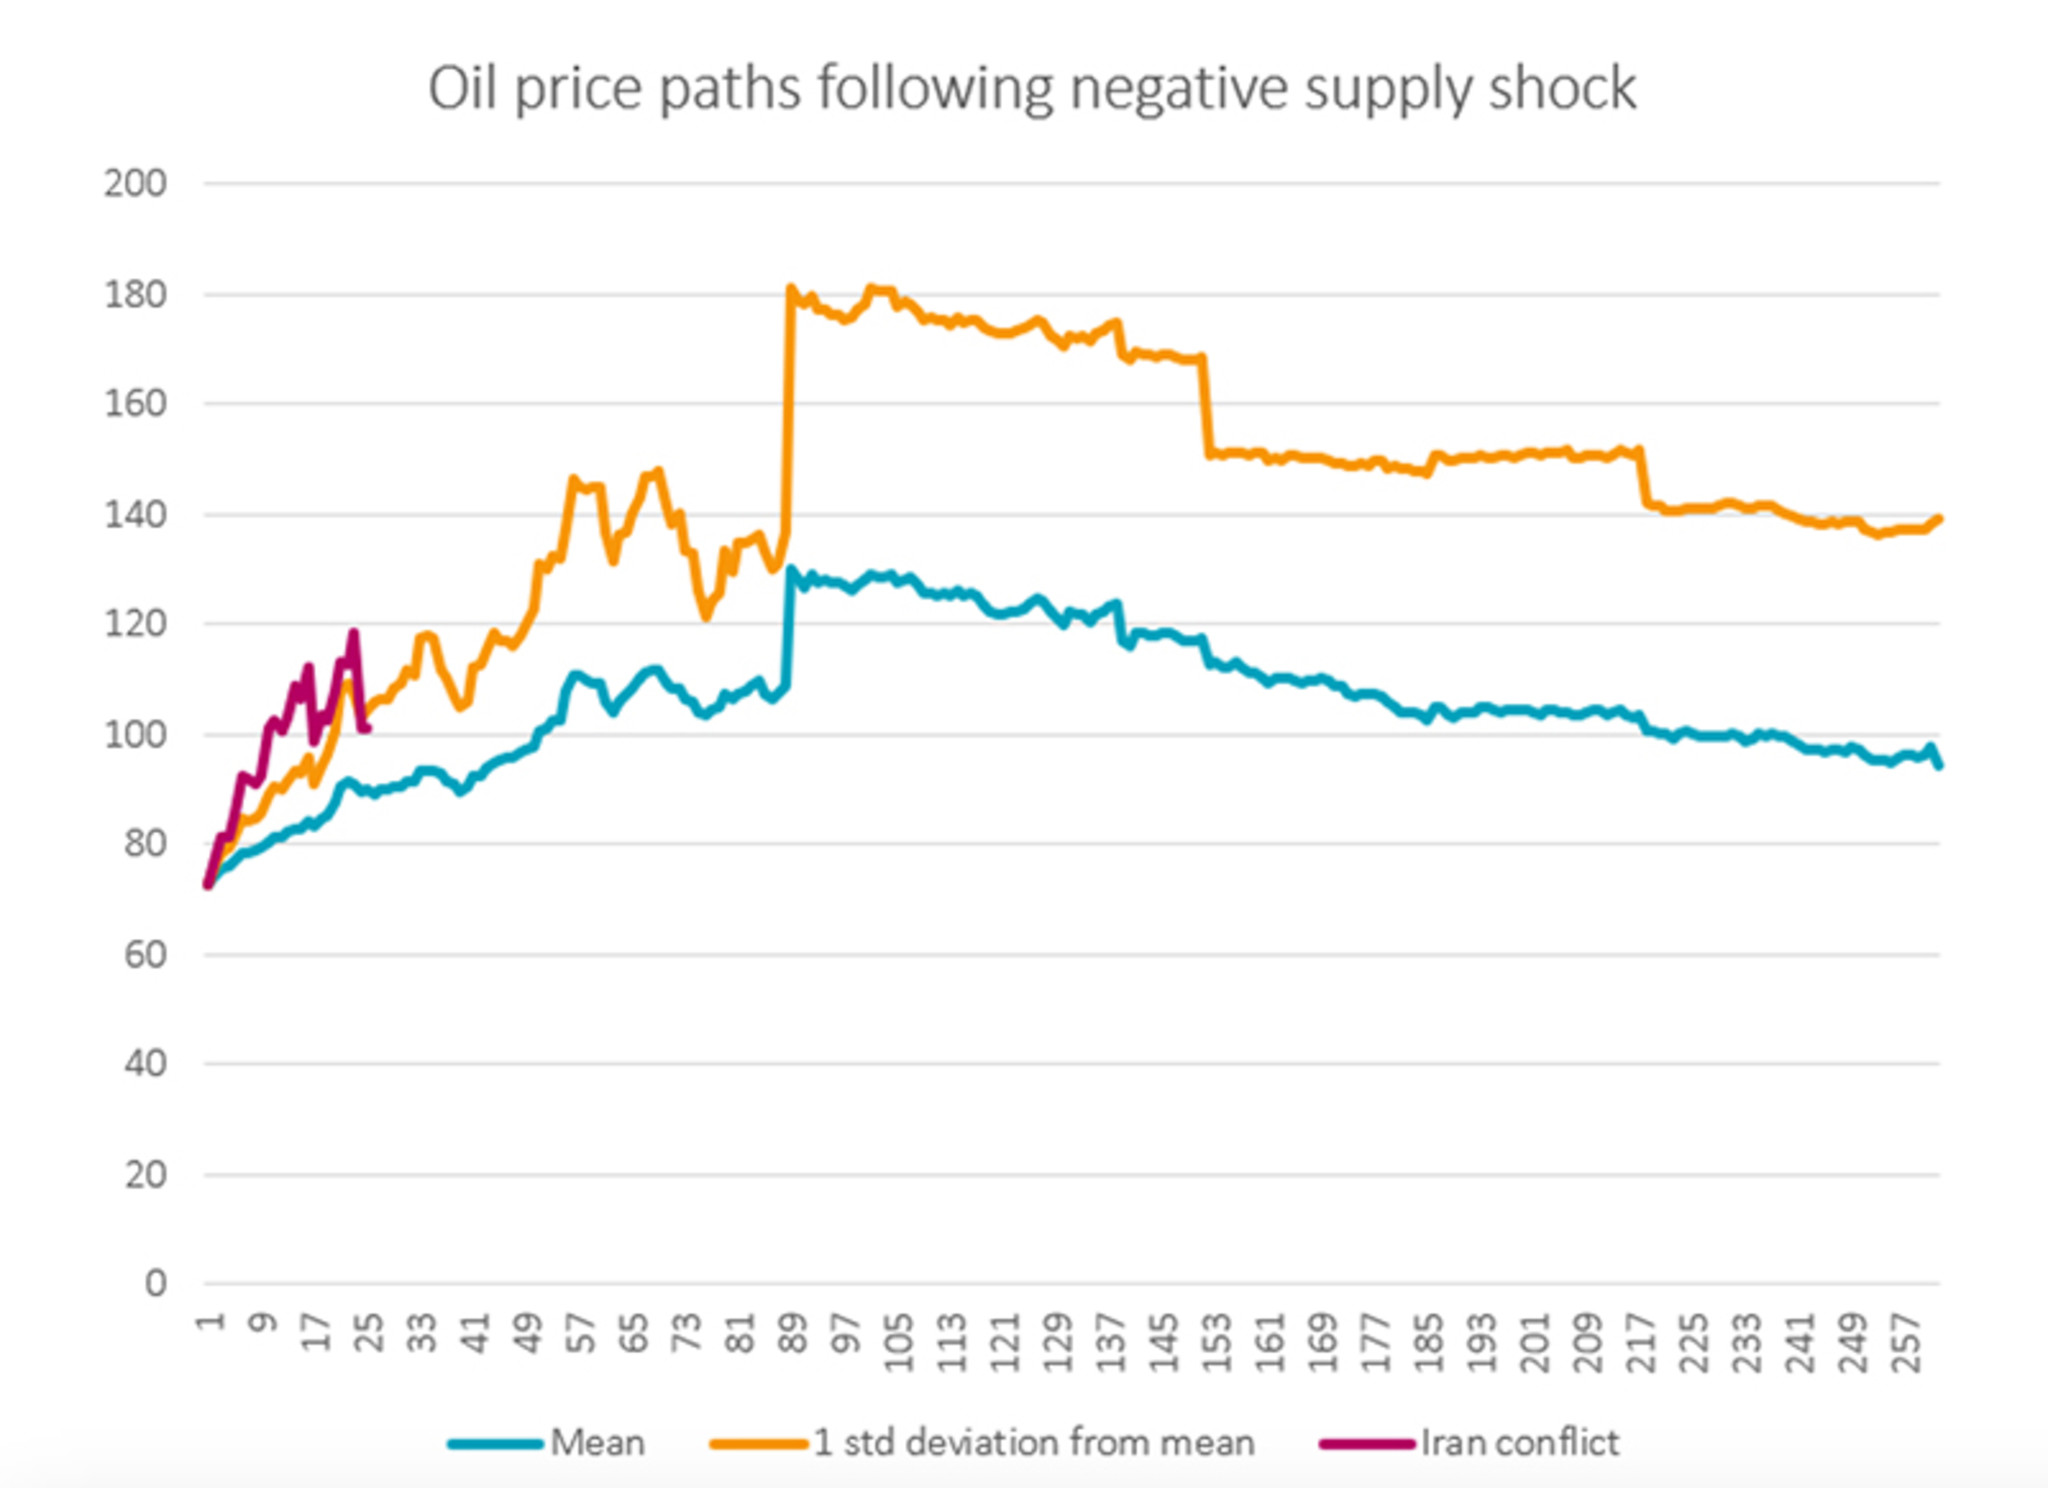
Source: LSEG Datastream, Robeco, April 2026. Events include Yom Kippur War, Iranian Revolution, Gulf war 1, OPEC supply constraints, Venezuelan oil strike, outages Iraq/Nigeria/Venezuela, Arab Spring, and the Russian invasion of Ukraine.