

Portfolio Manager

• 月次アウトルック
Shiny objects, solid returns
The meteoric rise and brief fall of gold and silver has led investors rushing to the entry and then the exit doors for the shiny metals. But they do have a genuine place in multi-asset portfolios, as their long-term returns justify some of the emotion over history’s most treasured objects, says investor Arnout van Rijn.
まとめ
- Gold and silver rose to record highs before a correction in late January
- Continuing tensions and supply/demand dynamics support shiny metals
- Central banks may hold the key and another market wobble is possible
Gold rose to break the historic USD 5,000 an ounce barrier in January and reached a peak of nearly USD 5,600 before plunging over 15% to USD 4,500 on 2 February. A much sought-after safe haven for centuries, gold has almost doubled in value over the past 12 months on fears of new conflicts over Greenland and Iran, along with ongoing US-China trade tensions.
Silver has seen an even more meteoric rise, rising to a record USD 121 an ounce before dropping back over 40% to USD 72. It has more than doubled in value over the past 12 months, partly on demand for it in industrial applications such as clean energy and AI vastly outstripping mine supply. Once the base for all coinage, silver still has a cachet as a form of money in its own right.
Both are classed as commodities in investment portfolios. But are they worth the hype? “After an amazing run of strong returns for shiny objects followed by a headline-grabbing correction, it is a good time to take stock,” says Van Rijn, Portfolio Manager with Robeco Investment Solutions’ multi-asset strategies. “We can do this first with a five-year and then with a one-year time horizon.”
“In our most recent five-year Expected Returns 2026-2030, we raised our return estimate for commodities from 4.75% to 5.25% (in EUR). We cited two fundamental reasons behind our forecast for above-average returns for the asset class.”
“The first is increased demand for metals to facilitate electrification, building new infrastructure, and for defense spending. Then we see that higher inflation expectations combined with high (US) debt leads to the diminishing appeal of alternative traditional safe havens such as US Treasuries.”
After an amazing run of strong returns for shiny objects followed by a headline-grabbing correction, it is a good time to take stock.
“We also stated that commodities were no longer cheap, though that was just based on the fact that they were trading above their five-year average prices (with the notable exception of oil). Since then, we added gold and initiated industrial metals in our portfolios.”
And the returns have been rolling in. Gold vastly outperformed equities in 2025 – despite the significant rally in global stock markets – as seen in the chart below. This is also the case going back 20 years to 2005.
Figure 1: Gold’s performance vs. equities and bonds since 2005
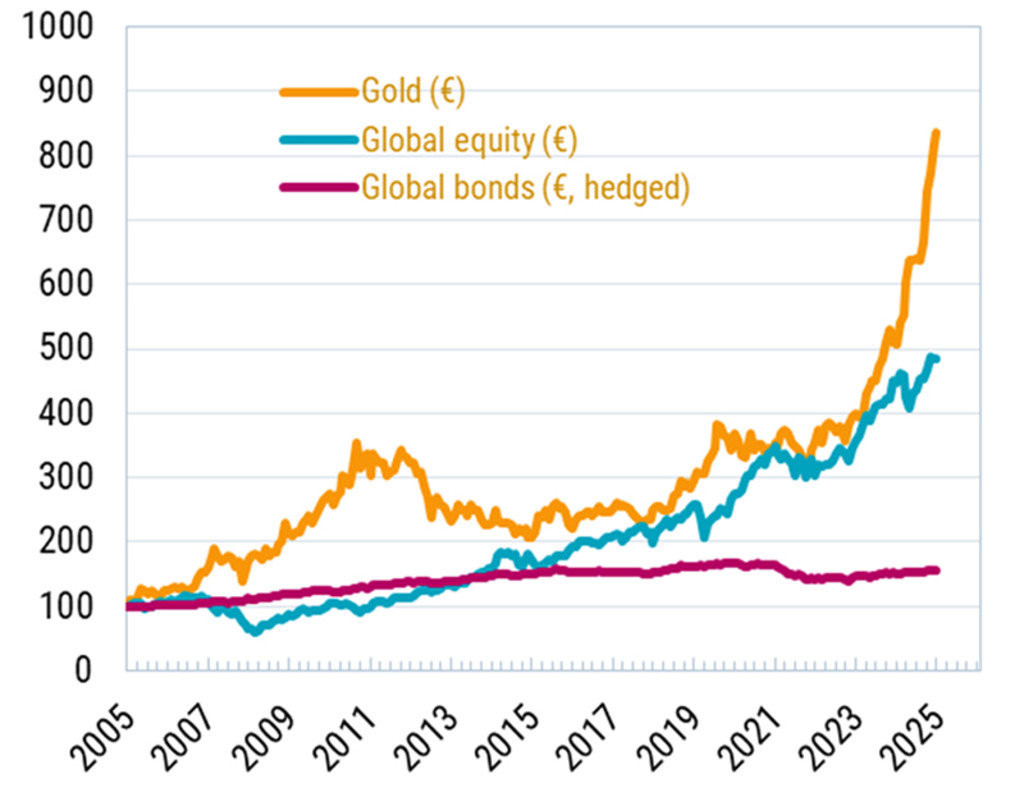
Past performance is no guarantee of future results. The value of your investments may fluctuate.
Source: Bloomberg, December 2025.
Going back even further, gold is the second-best performing asset class behind equities over the past half century. Silver is the third-best performer, though with much higher volatility. Commodities overall have generated a 5.7% return in euros over the past 50 years, though oil only rose 3.2%. This is shown in the table below.
“Shiny gold stands out as being safer, showing 18% volatility, while silver and oil are well above 30%,” Van Rijn says. “Also, shiny metals have low correlations with equities and bonds. Copper doesn’t have that long a history, but going back nearly 40 years, it has generated just over a 5% return, but again at relatively high volatility of 25%.”
“The conclusion for long-term investors is that it makes sense to have a structural allocation in a multi-asset portfolio to a non-yielding asset class like commodities. The shinier the metal, the better the return. We buy gold for diversification and long-term healthy returns, with limited volatility.”
Figure 2: Asset class returns since 1976
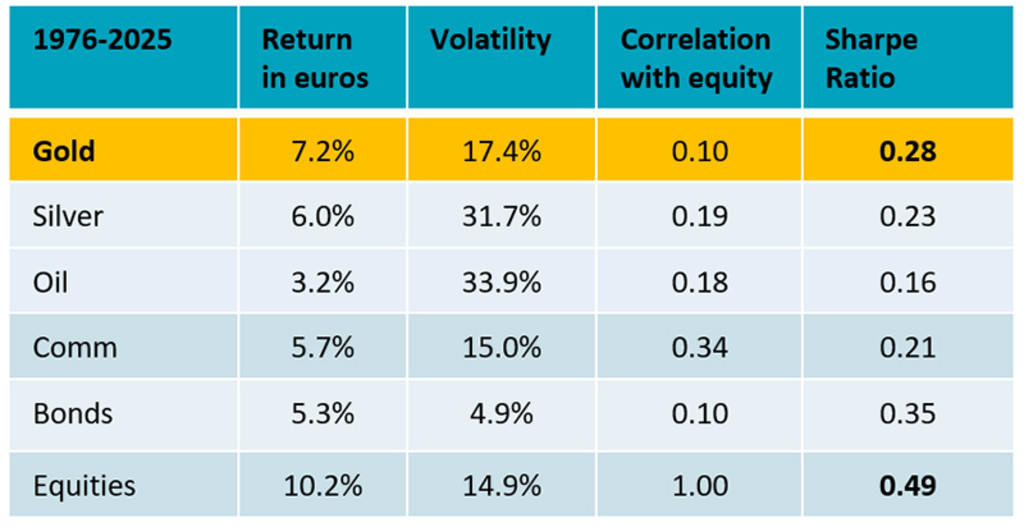
Past performance is no guarantee of future results. The value of your investments may fluctuate.
Source: Robeco, January 2026.
Costs of supply
But what about the cost-of-supply dynamics of two metals which are in limited supply? Only about 220,000 tons of gold have ever been mined in human history – about the same as three and a half Olympic swimming pools – and only about 60,000 tons remain in the ground, according to the World Gold Council. 1
“Only at the lower end can the marginal cost of production put a floor under valuations, because a lower price would kill supply and bring back balance,” Van Rijn says. “Clearly, that is not the case for gold and silver, with marginal production cost around USD 1,700/oz (with a spot price at USD 5,000) for gold and USD 20/oz (spot at USD 90) for silver.”
“Copper has better support with marginal costs of around USD 5/oz versus a market price of USD 6/oz. Oil is also better supported from this point of view.”
The macroeconomic environment supports gold as a hedge against excessive debt levels and money printing.
Triggering the correction
So, what could possibly go wrong? President Trump’s nominee of an experienced central banker and known hawk to be the new chairman of the US Federal Reserve – removing fears of more instability within the world’s largest financial system – triggered the meltdown in safe-haven metal prices.
“On a one-year horizon, looking into 2026, the macroeconomic environment supports gold as a hedge against excessive debt levels and money printing,” Van Rijn says. “However, until we see both the Treasury bond market and the dollar fall sharply, we don’t believe in the so-called debasement trade.”
“Worries about the Fed’s independence have faded, taking out some of the marginal buyers that believe the financial system, as we know it, is coming to an end. And given the current bullying coming from the US, it is hard to see a European central bank turn around and switch its gold holdings into US Treasuries.”
“Still, unpredictable policies under populist regimes could see a move to capitalize some of the gold gains on central banks’ balance sheets and upset the favorable demand/supply balance.”
Expect another wobble
Another wobble may be on the cards though, driven by the kind of bubble mentality that has also seen share prices related to artificial intelligence soar, and before that, the bitcoin ‘digital gold’ frenzy, Van Rijn says. Retail investors have been partly behind the gold rally, thanks to the ease of investing through ETFs.
“In 2025, gold prices were driven exponentially higher by (Chinese and American) retail traders, and a shakeout like the one seen in late January was inevitable,” Van Rijn says. “With more weak holders lured by the siren song of shiny objects, there is a fair chance of more selling in 2026. At current prices with a bullish consensus, profit-taking makes sense.”
Footnote
重要事項
当資料は情報提供を目的として、ロベコ・ジャパン株式会社(以下「当社」)が独自に作成、または当社のグループ会社(Robeco Institutional Asset Management B.V.およびその関連会社を含む)から提供された資料を当社が編集・翻訳したものです。資料中の個別の金融商品の売買の勧誘や推奨等を目的とするものではありません。記載された情報は十分信頼できるものであると考えておりますが、その正確性、完全性を保証するものではありません。意見や見通しはあくまで作成日における弊社の判断に基づくものであり、今後予告なしに変更されることがあります。運用状況、市場動向、意見等は、過去の一時点あるいは過去の一定期間についてのものであり、過去の実績は将来の運用成果を保証または示唆するものではありません。また、記載された投資方針・戦略等は全ての投資家の皆様に適合するとは限りません。当資料は法律、税務、会計面での助言の提供を意図するものではありません。 ご契約に際しては、必要に応じ専門家にご相談の上、最終的なご判断はお客様ご自身でなさるようお願い致します。 運用を行う資産の評価額は、組入有価証券等の価格、金融市場の相場や金利等の変動、及び組入有価証券の発行体の財務状況による信用力等の影響を受けて変動します。また、外貨建資産に投資する場合は為替変動の影響も受けます。運用によって生じた損益は、全て投資家の皆様に帰属します。したがって投資元本や一定の運用成果が保証されているものではなく、投資元本を上回る損失を被ることがあります。弊社が行う金融商品取引業に係る手数料または報酬は、締結される契約の種類や契約資産額により異なるため、当資料において記載せず別途ご提示させて頂く場合があります。具体的な手数料または報酬の金額・計算方法につきましては弊社担当者へお問合せください。 当資料及び記載されている情報、商品に関する権利は弊社に帰属します。したがって、弊社の書面による同意なくしてその全部もしくは一部を複製またはその他の方法で配布することはご遠慮ください。 商号等: ロベコ・ジャパン株式会社 金融商品取引業者 関東財務局長(金商)第2780号 加入協会: 一般社団法人 資産運用業協会