インデックス責任者


• インサイト
Indices insights: To what extent can carbon emissions data identify climate leaders and laggards?
Carbon emissions do not tell the full story on companies’ climate change awareness. That said, investors routinely rely on carbon metrics to track progress on their decarbonization objectives. In this Indices insights article, we analyze to what degree climate leaders and laggards can be identified using carbon footprint measures.
執筆者


PhD, Portfolio Manager Sustainable Index Solutions


Head of SI Thought Leadership and Climate & Biodiversity Strategist

Climate Data Scientist
まとめ
- Carbon footprint measure quantifies past or current greenhouse gas emissions
- The metric is less useful for identifying climate leaders and laggards
- Additional climate data that captures other dimensions is needed to discern between the two
As climate change becomes a key issue for most investors, the focus on carbon footprint reduction in investment portfolios has increased and net-zero commitments have moved into the mainstream.1 In response, industry players have developed several low-carbon investment vehicles and Paris-aligned benchmarks. What these have in common is the exclusion of companies with high carbon emissions or intensities.
Undeniably, generic carbon emissions data is useful for mapping out portfolio-level or entity-level decarbonization pathways. However, this begs the question of whether the simple approach of excluding or divesting from high carbon emitters is the most effective mechanism to transition to a low-carbon economy. In other words, it is worth examining whether the information gleaned from carbon emissions data suffices for identifying climate leaders and laggards.
Recent research shows that green innovation is primarily driven by the energy and materials sectors, two of the most carbon intensive industries.2 Within these segments, however, the more innovative firms do not necessarily have the lowest carbon emissions or intensities. As such, carbon emissions data alone is unlikely to be an effective guide to identifying firms involved with green innovation, or to distinguish between climate leaders and laggards, as it only considers past or current emissions.
An alternative approach to pinpointing climate leaders and laggards is to assess how firms impact specific climate-related SDGs. For example, Robeco’s proprietary SDG framework can be used to evaluate the contributions companies make to these SDGs, taking into account what they produce and how they operate. The resulting SDG scores then indicate if the firms positively or negatively impact the relevant climate-related SDGs, and to what extent.
Carbon emissions data is not useful in distinguishing between climate leaders and laggards
To evaluate this notion, we analyzed the relationship between climate leaders/laggards and their respective carbon footprints. Specifically, we looked at the intersection of companies that have low carbon footprints and either low or high climate-related SDG scores, and the intersection of firms that have high carbon footprints and either low or high climate-related SDG scores.
If carbon emissions data is a sufficient measure to differentiate between climate leaders and laggards, we would expect low carbon footprint companies to highly overlap with high climate-related SDG scores, and high carbon footprint companies to highly overlap with low climate-related SDG scores.
Figure 1 | A significant number of climate leaders/laggards are not identified with the use of carbon footprint data
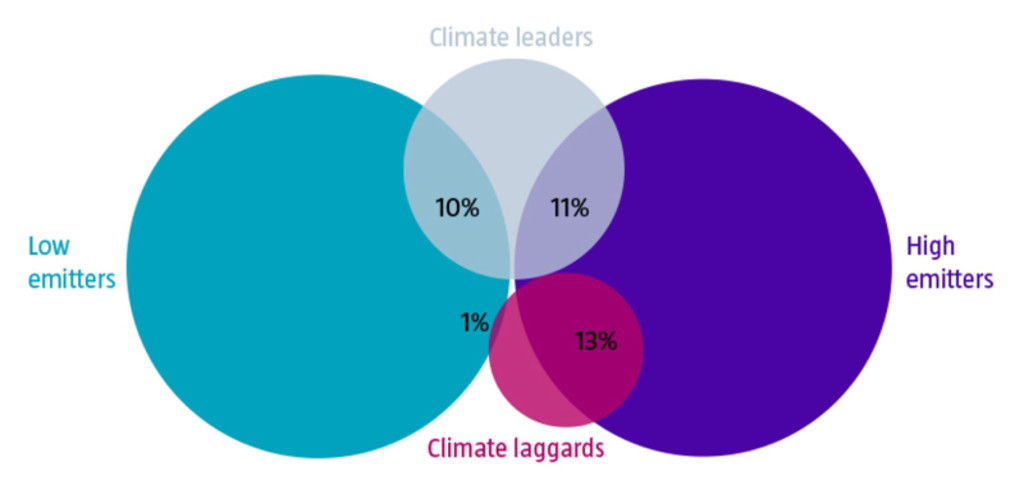
Source: Robeco, TruCost. The analysis is conducted using data as of end of December 2021.
As shown in Figure 1, we found that carbon emissions data is too crude to effectively differentiate between climate leaders and laggards on an issuer level. While 13% of high emitters are considered climate laggards, there is also a considerable share of 11% of high emitters which are viewed as climate leaders. Put differently, a low-carbon approach that relies solely on carbon footprint data for exclusions or divestments is also likely to ignore high carbon-emitting firms which, in fact, contribute positively to the climate-related SDGs and are deemed essential for the transition to a low-carbon economy.
Focusing on the group of low emitters based on carbon emissions, a portion of 1% are seen as climate laggards as these companies contribute negatively to the climate-related SDGs. But more strikingly, only 10% of low emitters are classified as climate leaders, less than the share of climate leaders within the high emitters cluster. This suggests that carbon emissions data is ineffective in identifying firms involved with green innovation. Therefore, complementary stock-level climate data is required to achieve this goal.

Subscribe - Indices Insights
Receive an update as soon as a new article is available with insights about sustainability, factors or markets.
Data and methodology
For our analysis, we based our investment universe on the constituents of the MSCI World Investable Market Index (MSCI World IMI) as at the end of December 2021. We used carbon footprint data sourced from TruCost, defined as Scope 1 and 2 divided by enterprise value including cash (EVIC).
We used SDG scores based on Robeco’s proprietary SDG framework. We focused only on certain climate-related SDGs, specifically SDG 7 (affordable and clean Energy), SDG 11 (sustainable cities and communities) and SDG 13 (climate action). To calculate the final climate-related SDG score, we took the lowest of the three scores if one of them was negative, and the highest of the three scores if they were all positive. Combined, this analysis covered 73% of the stocks and 85% of the total market capitalization of the MSCI World IMI.
We then sorted stocks into 3x3 mutually exclusive groups based on their carbon footprints and climate-related SDG scores. For carbon footprints, we grouped stocks using the 30th and 70th percentiles. Companies that had a climate-related SDG score of -3 or -2 were classified as climate laggards, and those with a climate-related SDG score of +2 or +3 were classified as climate leaders. Panel A in Table 1 depicts the percentage of stocks that belonged to each of the nine groups. Panel B shows the conditional distribution on the carbon footprints.
Table 1 | Distribution of stocks sorted on carbon footprints and climate-related SDG scores
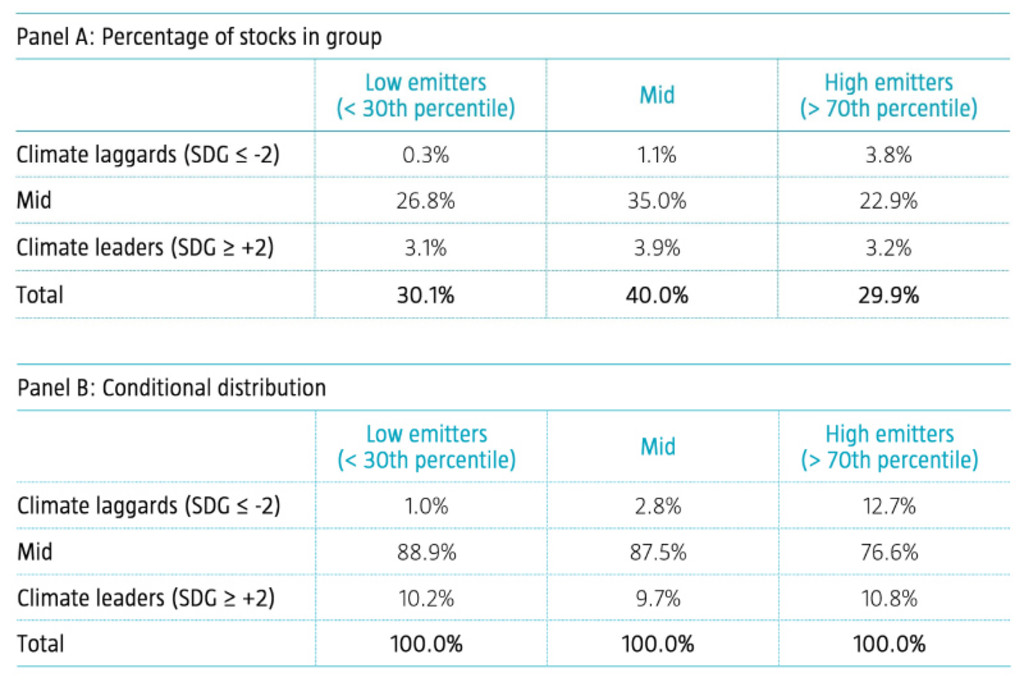
Source: Robeco, TruCost. The analysis is conducted using data as of end of December 2021.
Based on the conditional distribution, we constructed proportional Venn diagrams. These display the overlap between high emitters and climate laggards, high emitters and climate leaders, low emitters and climate laggards as well as low emitters and climate leaders. The total area of the circles are proportional to the number of stocks that belong to a group.
Conclusion
While carbon footprint is a useful metric for mapping out portfolio-level or entity-level decarbonization pathways, we find that it is less effective in differentiating between climate leaders and laggards. Indeed, a significant number of climate leaders and climate laggards are not identified using this measure. For this purpose, we suggest complementing carbon footprint measures with additional stock-level climate data that captures dimensions in addition to emissions.
Footnotes
1 See: Robeco, March, 2022, “2022 global climate survey”, Robeco publication.
2 See: Cohen, L., Gurun, U.G., and Nguyen, Q., January 2021, “The ESG-innovation disconnect: evidence from green patenting”, SSRN working paper, and Huij, J., Laurs, D., Stork, P. A., and Zwinkels, R. C. J., November 2021, “Carbon Beta: A market-based measure of climate risk”, SSRN working paper.
Background to sustainability metrics
In defining sustainability, investors have a multitude of dimensions and metrics they could consider. For example:
Values-based exclusions
ESG integration
Impact investing
ESG scores typically put more focus on the operations of a business, whereas SDG scores also incorporate the impact that the business’ products and/or services have on society.
We see client sustainability objectives increasingly moving towards avoiding controversial businesses (values-based exclusions) and including those that provide sustainable solutions (impact investing). In the first few articles of our Indices Insights series, we will empirically show how the different sustainability metrics (negative screening/exclusions, ESG, SDG) relate to these increasingly impact-oriented client sustainability objectives.
The Indices insights series provides new insights focused on index investing, particularly on the topics of sustainable investing, factor investing and/or thematic investing. The articles are written by the Sustainable Index Solutions team and often in close cooperation with a Robeco specialist in the field. The team has vast experience in research and portfolio management and has been designing sustainable, factor and thematic indices since 2015 for a large variety of clients: sovereign wealth funds, pension funds, insurers, global investment consultants, asset managers and private banks. The team can also tailor sustainable indices to cater to client-specific needs. For more information please visit our website Sustainable Index Solutions (robeco.com).
Indices Insights
重要事項
当資料は情報提供を目的として、ロベコ・ジャパン株式会社(以下「当社」)が独自に作成、または当社のグループ会社(Robeco Institutional Asset Management B.V.およびその関連会社を含む)から提供された資料を当社が編集・翻訳したものです。資料中の個別の金融商品の売買の勧誘や推奨等を目的とするものではありません。記載された情報は十分信頼できるものであると考えておりますが、その正確性、完全性を保証するものではありません。意見や見通しはあくまで作成日における弊社の判断に基づくものであり、今後予告なしに変更されることがあります。運用状況、市場動向、意見等は、過去の一時点あるいは過去の一定期間についてのものであり、過去の実績は将来の運用成果を保証または示唆するものではありません。また、記載された投資方針・戦略等は全ての投資家の皆様に適合するとは限りません。当資料は法律、税務、会計面での助言の提供を意図するものではありません。 ご契約に際しては、必要に応じ専門家にご相談の上、最終的なご判断はお客様ご自身でなさるようお願い致します。 運用を行う資産の評価額は、組入有価証券等の価格、金融市場の相場や金利等の変動、及び組入有価証券の発行体の財務状況による信用力等の影響を受けて変動します。また、外貨建資産に投資する場合は為替変動の影響も受けます。運用によって生じた損益は、全て投資家の皆様に帰属します。したがって投資元本や一定の運用成果が保証されているものではなく、投資元本を上回る損失を被ることがあります。弊社が行う金融商品取引業に係る手数料または報酬は、締結される契約の種類や契約資産額により異なるため、当資料において記載せず別途ご提示させて頂く場合があります。具体的な手数料または報酬の金額・計算方法につきましては弊社担当者へお問合せください。 当資料及び記載されている情報、商品に関する権利は弊社に帰属します。したがって、弊社の書面による同意なくしてその全部もしくは一部を複製またはその他の方法で配布することはご遠慮ください。 商号等: ロベコ・ジャパン株式会社 金融商品取引業者 関東財務局長(金商)第2780号 加入協会: 一般社団法人 資産運用業協会