Chief Researcher
クオンツ運用の価値を探求
最先端クオンツ戦略の情報やインサイトを定期的にお届けします。


The 2018-2020 quant equity crisis posed an exceptional challenge to quantitative managers due to a rare combination of circumstances. There was basically only one way to outperform during this period, investing in the largest and most expensive growth stocks. Meanwhile, established factors were only effective to the extent that they provided implicit exposure to the same large growth equities. Thus, there were numerous ways to fail during the 2018-2020 period, but essentially only one way to succeed.


The recent quant equity crisis is commonly attributed to the underperformance of the value factor, which is a key pillar in many quantitative stock selection models. However, value is just one of the factors used by quantitative investors. Therefore, one can wonder why other factors apparently failed to offset, or provide more protection against the losses of the value factor.
In order to address this question, we conduct a detailed analysis of factor performance during the quant equity crisis, which we define as the period from June 2018 to August 2020. Figure 1 illustrates that value experienced a severe drawdown, while the size and investments factors also charted in negative territory. The latter result is not surprising, given that the investment and value effects are known to be closely related.1 On the other hand, the profitability and momentum factors fared relatively well during the period.
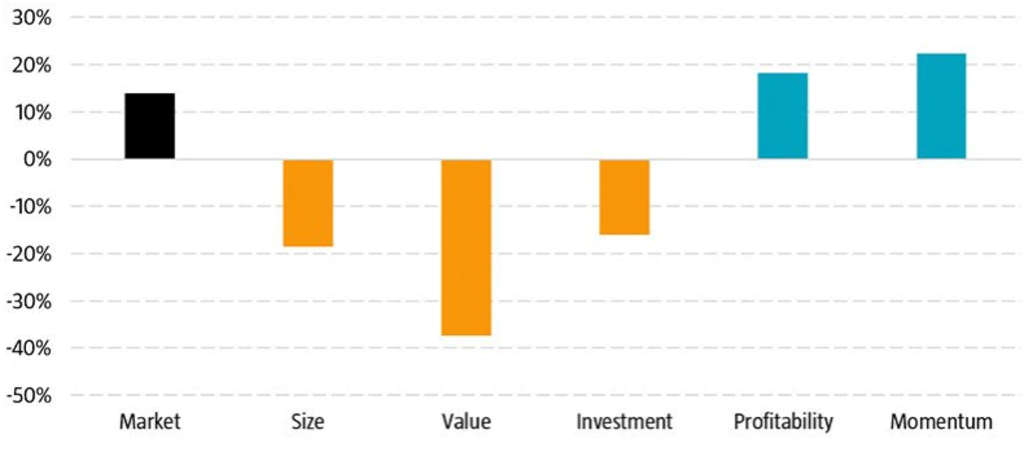
Source: Data library of Professor Kenneth French. Next to the capitalization-weighted market portfolio we consider the standard academic factors, size (SMB), value (HML), investment (CMA), profitability (RMW), and momentum (WML), as described in Fama and French (1993, 2015). The HML, CMA, RMW, and WML factors are based on 2x3 portfolios sorted independently on size and the target factor. All portfolios are capitalization weighted, and all returns are compounded total returns in US dollars. These returns reflect hypothetical, backtested portfolios which ignore costs, fees and taxes. Past returns are no guarantee for the future.
To better understand the drivers behind this factor performance, we look at the market-relative returns of portfolios sorted according to the various factors within different market-cap groups. As exhibited in Table 1, we observe that almost all the outperformance stemmed from investing in the largest stocks with particular factor characteristics.
Our research also challenges the notion that there was more than one way to outperform in the mega-cap space. We find that mega-cap profitability and momentum were essentially mega-cap growth in disguise. In fact, mega-cap top momentum and mega-cap top profitability portfolios behaved very similarly to the mega-cap growth portfolio, with the correlations between the monthly market-relative returns amounting to 75% and 89%, respectively.
最先端クオンツ戦略の情報やインサイトを定期的にお届けします。
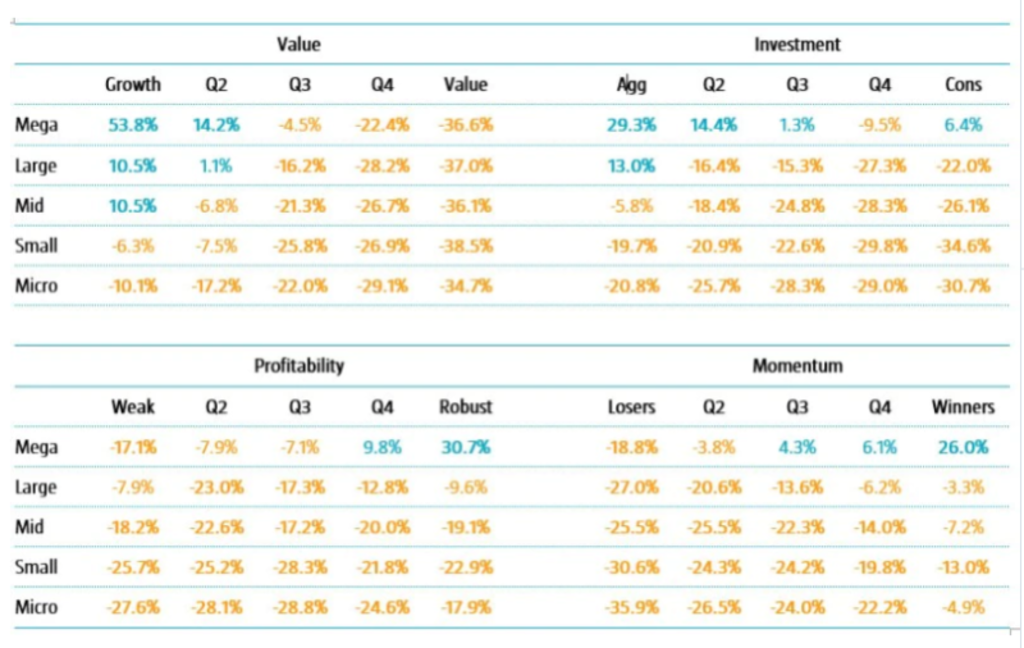
Source: Data library of Professor Kenneth French, Robeco. Next to the capitalization-weighted market portfolio we consider the standard academic factors, size (SMB), value (HML), investment (CMA), profitability (RMW), and momentum (WML), as described in Fama and French (1993, 2015). The factors are based on 5x5 independently sorted portfolios. All portfolios are capitalization weighted, and all returns are compounded total returns in US dollars. These returns reflect hypothetical, backtested portfolios which ignore costs, fees and taxes. Past returns are no guarantee for the future. Please note double-digit returns are highlighted in bold.
We conclude that there was basically only one way to outperform during this period, namely by investing in the largest and most expensive growth stocks. Indeed, our analysis shows that the mega-cap growth portfolio clearly had the strongest return as seen in Figure 2. This was the dominant phenomenon during the quant equity crisis, in which there were many ways to fail, but essentially only one way to succeed. This concentration of outperformance in one corner of the market and underperformance elsewhere is illustrated in Figure 2.
There were many ways to fail, but essentially only one way to succeed David Blitz


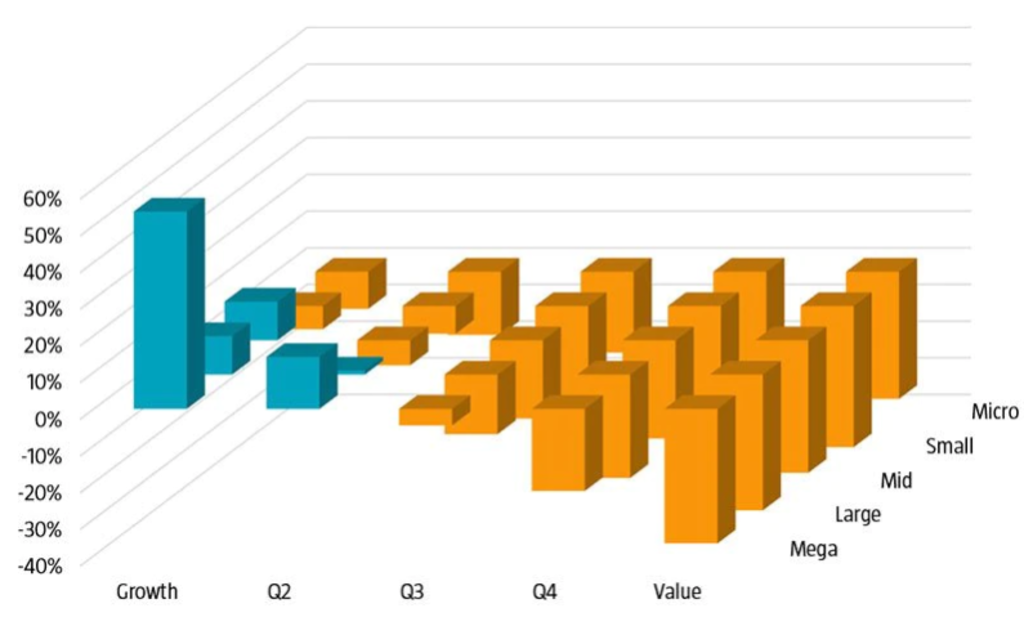
Source: Data library of Professor Kenneth French. Next to the capitalization-weighted market portfolio we consider the standard academic factors, size (SMB), value (HML), investment (CMA), profitability (RMW), and momentum (WML), as described in Fama and French (1993, 2015). The factors are based on 5x5 independently sorted portfolios. All portfolios are capitalization weighted, and all returns are compounded total returns in US dollars. These returns reflect hypothetical, backtested portfolios which ignore costs, fees and taxes. Past returns are no guarantee for the future.
We also compare the 2018-2020 episode with past major drawdowns of the value factor and find some notable differences. Most importantly, previous value drawdowns are better characterized as momentum rallies, because the outperformance of the momentum factor overshadowed the underperformance of the value factor. As a result, past value drawdowns did not necessarily cause quant equity crises.
Another important difference was the sharp underperformance of small stocks compared to their large peers. During previous value drawdowns, there were still opportunities for outperformance in smaller size segments. However, during 2018-2020, even the best-performing pockets in the small- and mid-cap space could not keep up with large growth stocks.
Apart from 2018-2020, there is actually only one other true quant equity crisis in our sample, which occurred during the strong market rebound seen in the first half of 2009. What the two crises have in common is that the main cause can be traced to one particular factor. In 2009, however, it was not the value factor but the momentum factor that crashed, due to a sharp recovery of the stocks that had suffered the largest losses during the 2008 debt crisis. Another notable difference with 2018-2020 is that the 2009 quant equity crisis was relatively short-lived. Factors resumed their upward trend within six months.
Some wonder whether the 2018-2020 quant equity crisis means factor-based investing is permanently impaired. In our view, the large losses on one factor, which were not offset by gains on other factors, do not imply a structural break, nor that factor premiums which have existed for many decades have disappeared all of a sudden. Therefore, we would summarize this period as an unusual combination of circumstances that culminated in a perfect storm for multi-factor investors, but also as an episode from which quantitative investment strategies can be expected to recover again in due course.
1See: Fama, E. F., and French, K. R., 2015. “A five-factor asset pricing model.” Journal of Financial Economics, 116(1), 1-22.
当資料は情報提供を目的として、ロベコ・ジャパン株式会社(以下「当社」)が独自に作成、または当社のグループ会社(Robeco Institutional Asset Management B.V.およびその関連会社を含む)から提供された資料を当社が編集・翻訳したものです。資料中の個別の金融商品の売買の勧誘や推奨等を目的とするものではありません。記載された情報は十分信頼できるものであると考えておりますが、その正確性、完全性を保証するものではありません。意見や見通しはあくまで作成日における弊社の判断に基づくものであり、今後予告なしに変更されることがあります。運用状況、市場動向、意見等は、過去の一時点あるいは過去の一定期間についてのものであり、過去の実績は将来の運用成果を保証または示唆するものではありません。また、記載された投資方針・戦略等は全ての投資家の皆様に適合するとは限りません。当資料は法律、税務、会計面での助言の提供を意図するものではありません。 ご契約に際しては、必要に応じ専門家にご相談の上、最終的なご判断はお客様ご自身でなさるようお願い致します。 運用を行う資産の評価額は、組入有価証券等の価格、金融市場の相場や金利等の変動、及び組入有価証券の発行体の財務状況による信用力等の影響を受けて変動します。また、外貨建資産に投資する場合は為替変動の影響も受けます。運用によって生じた損益は、全て投資家の皆様に帰属します。したがって投資元本や一定の運用成果が保証されているものではなく、投資元本を上回る損失を被ることがあります。弊社が行う金融商品取引業に係る手数料または報酬は、締結される契約の種類や契約資産額により異なるため、当資料において記載せず別途ご提示させて頂く場合があります。具体的な手数料または報酬の金額・計算方法につきましては弊社担当者へお問合せください。 当資料及び記載されている情報、商品に関する権利は弊社に帰属します。したがって、弊社の書面による同意なくしてその全部もしくは一部を複製またはその他の方法で配布することはご遠慮ください。 商号等: ロベコ・ジャパン株式会社 金融商品取引業者 関東財務局長(金商)第2780号 加入協会: 一般社団法人 資産運用業協会
重要なお知らせ 当社や当社役職員を装ったSNSアカウントやウェブサイト等を使った投資勧誘にご注意ください さらに表示