Equity Analyst

• 市場觀點
Power demand is surging: Who will benefit from a new electricity supercycle?
The US is entering a new era of electricity demand growth – a power supercycle. This will mean a seismic shift in how capital is deployed across energy generation, grid infrastructure, and storage technologies, and significant investment opportunities for Robeco’s Smart Energy strategy.
作者

概要
- AI, electrification and decarbonization are accelerating power demand
- Legacy grids and infrastructure underinvestment are limiting supply
- Demand-supply mismatch is driving a new investment supercycle
The US is at the epicenter of this acceleration, with power demand in the next decade expected to increase almost three times the pace of the last two.1 This will bring its total consumption from 4,100 TWh in 2024 to 5,300 TWh in 2035.2 Such an increase is equivalent to the combined annual consumption of France, Germany and Italy.3
Figure 1 – Electricity demand set to surge in coming decades
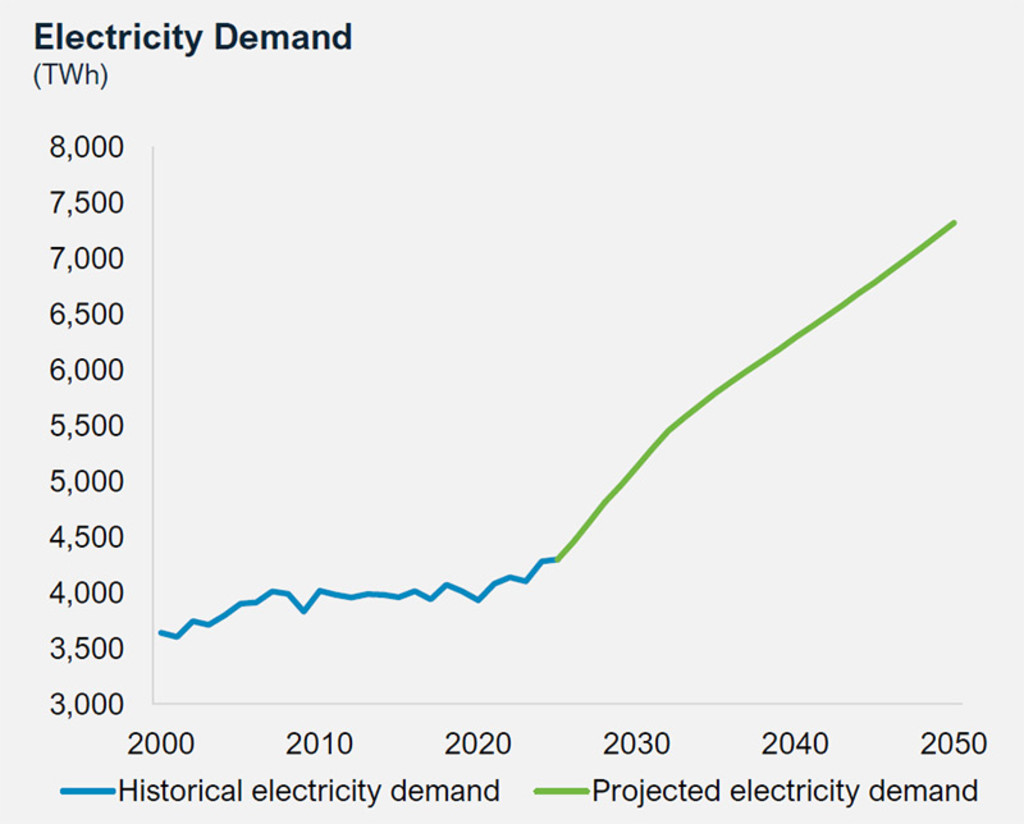
Source: NextEra Energy, September 2025.
US power demand in the next decade is expected to increase almost three times the pace of the last two
The primary demand drivers are clear:
Data centers / AI computing: Already big users of electricity, data center power consumption is expected to increase at an annual rate of 15% (CAGR) by 2035. Data centers already account for around 3% of the total demand and could well reach 10% by 2035.
Residential & commercial heating and cooling: According to the IEA, electricity will overtake natural gas for space and water heating through new construction or retrofits as office buildings, retail spaces, and institutional facilities transition to electric HVAC. We expect these segments to grow at a rate of 1.1% annually (CAGR) to 2035, well above the 0.7% rate of the past decade.
Industrial electrification: US manufacturing is expanding – driven by tariffs and reshoring trends – and integrating AI-driven automation and robotics. We expect industrial electrification to grow 1.9% CAGR to 2035, well above the 0.6% historical average.
Transport: While US EV sales have disappointed, there are around 5 million EVs on US roadways today representing around 2% of the total passenger fleet. Even if the mix of new vehicle sales would remain flat (~9%), the number of EVs would still rise by ~15% CAGR to 2035 to 22 million. In 2035, EVs could represent close to 10% of the total demand.
Figure 2 – Main drivers of increased US power demand
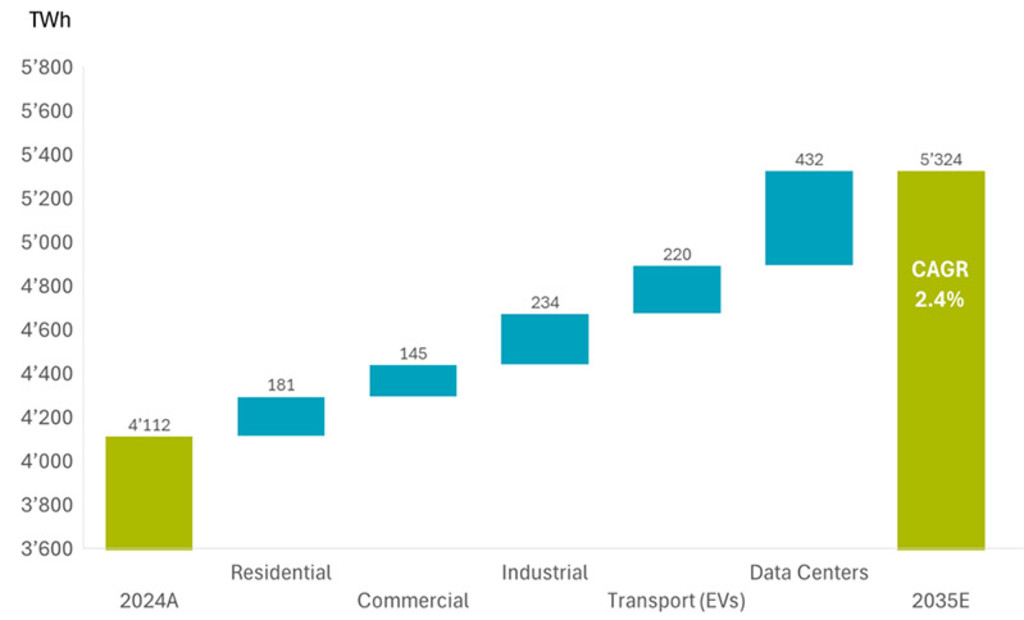
After more than two decades of flat demand, total US energy demand is expected to rise to 5,324 TWh by 2035 (up 2.4% CAGR from the actual demand of 4,112 TWh in 2024). Data centers are expected to account for 432 TWh or 36% of new demand, followed by the electrification of industry (19%), transport (18%), residential (15%), and commercial buildings (12%).
Source: Robeco, 2025.
A supply-demand mismatch is raising costs
After decades of flat consumption, the US grid is not prepared for this scale of growth. Coal retirements and slow permitting for renewables have constrained electricity supply.4 Power regulators warn that half the US is facing power supply shortfalls in the next decade.5
Distribution complicates things further. Over 30% of transmission lines and nearly half of distribution infrastructure are approaching end-of-life. Capacity prices in PJM markets have risen tenfold in four years, while electricity prices have grown at 4% annually, underscoring the stress between reliability and affordability.6 Over the past five years, electric bills across the US have increased 24%. 7
獲取最新市場觀點
訂閱我們的電子報,時刻把握投資資訊和專家分析。
Policy tailwinds and regulatory shifts
The US policy environment is evolving to meet this surge. The 2025 Energy Emergency Order introduced fast-track permits and deregulation, particularly for gas-fired power plants and transmission upgrades. Simultaneously, the legacy incentives of the Inflation Reduction Act and the One Big Beautiful Bill Act continue to channel capital into renewables and grid resilience. The bipartisan consensus on grid reliability ensures a supportive backdrop for US energy infrastructure investment.
Addressing the supply gap
We anticipate that the US will add between 500 GW and 600 GW of new capacity by 2035, with renewables accounting for approximately 60% to 70% of these additions. Natural gas will remain the backbone of reliability. Despite political scrutiny and the One Big Beautiful Bill, renewables are still expected to outpace new gas capacity. Supported by the current US administration, in the interim, coal plants may see extensions and utilities are already actively planning new gas generation projects. Nuclear power is also gaining popularity but high-cost and long-construction times mean it’s not a viable near-term solution.8
Despite political scrutiny and the One Big Beautiful Bill, renewables are still expected to outpace new gas capacity
According to the International Energy Agency (IEA), the US energy mix by 2040 could be made of 900 GW of solar, 600 GW of wind, 450 GW of natural gas, 250 GW of battery storage, 100 GW coal and nuclear.9 This mix highlights the need for ‘always-available’ dispatchable power to complement intermittent renewable energy sources.
Figure 3 – Electricity supply is shifting to renewables and gas
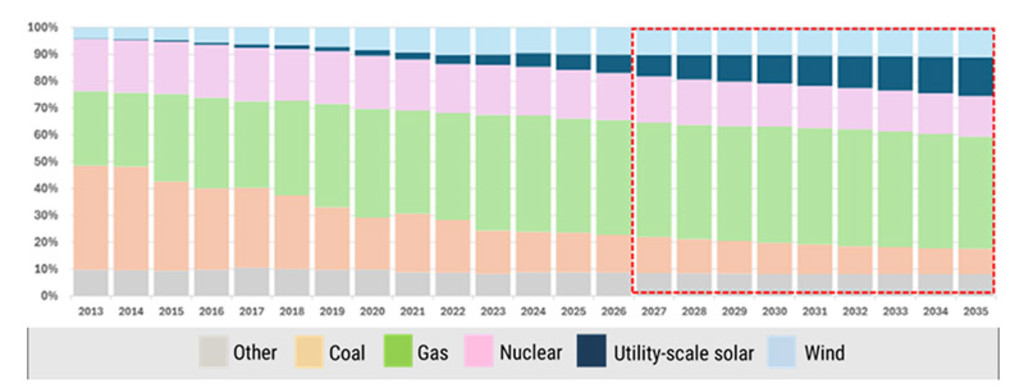
Source: Jefferies, Citi, EIA, Wood Mackenzie, BNEF, September 2025.
Grid modernization: A public/private effort
As load growth accelerates, legacy power networks will come under increasing strain. The Department of Energy stressed that the US will need to build as much new transmission capacity in the next 10 years as it did over the past 60. By 2050, power networks will need to be at least two to three times larger to keep up with electrification trends, data center expansion and the clean energy transition.
The buildout means grid spending is expected to exceed USD 100 billion annually by the end of the decade, with grid infrastructure, smart grid components, as well as end-use equipment suppliers expected to benefit.
Grid infrastructure – transmission towers, high-voltage cables, step-down transformers, switchgear
Smart grid components – hard and software equipment including sensors, chips and analytics
End-use equipment – EV components, charging networks, building electrification gear
As the climate transition and the push to decarbonize accelerate, utilities are designing plans to integrate dispatchable and renewable assets. Companies active in wind and solar value chains, battery and storage players as well as other power ‘enablers’ will undoubtedly benefit from these moves to secure power generation.
Meanwhile, Big Tech hyperscalers such as Amazon, Google, and Microsoft are increasingly acting as power producers – investing in on-site gas turbines and modular nuclear pilots as well as negotiating exclusive power-purchasing agreements (PPAs) with local utilities. Combined with public sector expansion, private efforts will further boost investments in smart energy generation and transmission infrastructure.
Conclusion
The global economy is shifting from hydrocarbons to electrons. That’s a multi-decade evolution underpinned by AI, EVs and electrification, industrial policy, and an aging and ill-equipped grid. It is nothing short of a power demand supercycle. In this new era, access to power becomes the new competitive advantage, and strategies aligned with the buildout of generation, storage, and grid capacity stand at the forefront of a compelling investment cycle.
Important note: The companies referenced are for illustrative purposes only in order to demonstrate the investment strategy on the date stated. The companies are not necessarily held by Robeco’s Smart Energy strategy. This is not a buy, sell or hold recommendation, nor should any inference be made on the future development of the company.
Footnotes
1 Moving from two decades of less than 1% growth to 2.4% CAGR through 2035.
2 ‘Power check: Watt’s going on with the grid?.’ Bank of America Global Research. July 2025.
3 Energy consumption figures for Italy, Germany and France are for 2023.
4 US Energy Information Administration, February 2024. US Department of Energy, Transmission Interconnection Roadmap: Transmission Interconnection by 2035.
5 ‘Half US at high risk of power shortfall in next decade, regulators says. Reuters, December 2024.
6 Electricity is more expensive in peak hours due to high demand. Capacity pricing refers to the extra cost paid by end-consumers to ensure electricity that is available on-demand. PJM refers to the regional grid operator for the US Mid-Atlantic and Midwest regions. These represent major economic and population hubs which can reliably proxy broader trends in US electricity use.
7 US Energy Information Administration, 2025.
8 The average construction time is 9.5 years globally. World Nuclear Performance Report, World Nuclear Association, 2025. This figure varies significantly by region and reactor type. China achieves shorter construction time due to standardized designs and streamlines regulatory processes. Western countries tend to have longer timelines frequently exceeding 15 years due to complex permitting, financing among other challenges. (IEA, JP Morgan)
9 IEA World Energy Outlook, 2024.
重要資料
本網站僅供《證券及期貨條例》(香港法例第571章)及其附屬法例所界定之專業投資者瀏覽及使用。 投資涉及風險。過往表現並不代表未來表現。本網站所載資料僅供參考之用,並不構成任何投資建議,亦非作出買賣任何證券或採納任何投資策略之要約或招攬。投資者不應僅憑本網站提供之資料作出投資決定,在作出任何投資決定前,應徵詢獨立意見(包括有關稅務影響之意見)。投資者應確保完全理解投資產品的相關風險,亦應考量自身投資目標及風險承受水平。投資乃閣下之個人決定。除非銷售投資產品的中介人已向閣下告知該投資產品適合閣下,並已解釋其符合閣下投資目標之原因,否則閣下不應投資。請參閱相關發售文件或其他法律文件,以獲取包括風險因素在內的進一步詳情。 本網站由荷寶投資管理香港有限公司發布,該公司受香港證券及期貨事務監察委員會(「證監會」)規管(中央編號:APU851)。本網站未經證監會審閱。 無法保證任何投資產品可實現其投資目標。概不就任何投資產品之表現或投資回報作任何聲明或承諾。投資的價值或會波動。本網站所載過往表現、推算或預測,均不應視作未來表現之保證或指標,且概不提供任何明示或暗示之保證。本網站內容建基於相信為可靠之來源,惟因應資料傳遞技術特性及須採用多項數據來源(包括第三方內容),故概不保證其準確性。所述觀點僅乃截至上述日期,或會隨市況變化而改變,可予更改而毋須另行通知。該等意見可能有別於其他荷寶投資專業人士之意見。因使用本材料或當中所載任何評論、意見或估算而引致之直接、間接或相應損失,荷寶概不承擔法律責任。荷寶並無責任更新本網站或任何網站內容。未經荷寶事先書面許可,不得複製、分發或刊發本網站任何材料。 除非另有說明,資料來源:荷寶。