Portfolio Manager

• インサイト
Quant chart: Asian hardware stocks show big gains and big swings
The AI spending boom may be taking place in US boardrooms, but much of the action is showing up on Asian factory floors. Share-price gains have been enormous, but the journey has differed sharply from one company to the next.
執筆者



As the largest US technology companies pour billions into AI infrastructure, much of that spending flows through Asia’s hardware supply chain. Taiwan sits at its center, with Korean companies also supplying essential memory, components and manufacturing capacity.
Across the 51 stocks shown in Figure 1, the median one-year return was 173%. Yet the median decline from a recent high was 23%. While twenty stocks gained at least 200% over the year, seven were 40% or more below their recent peaks. As our chart shows, the market still looks exceptionally strong over 12 months, but much less uniform close up.
Figure 1 | Big gains have come with very different drawdowns
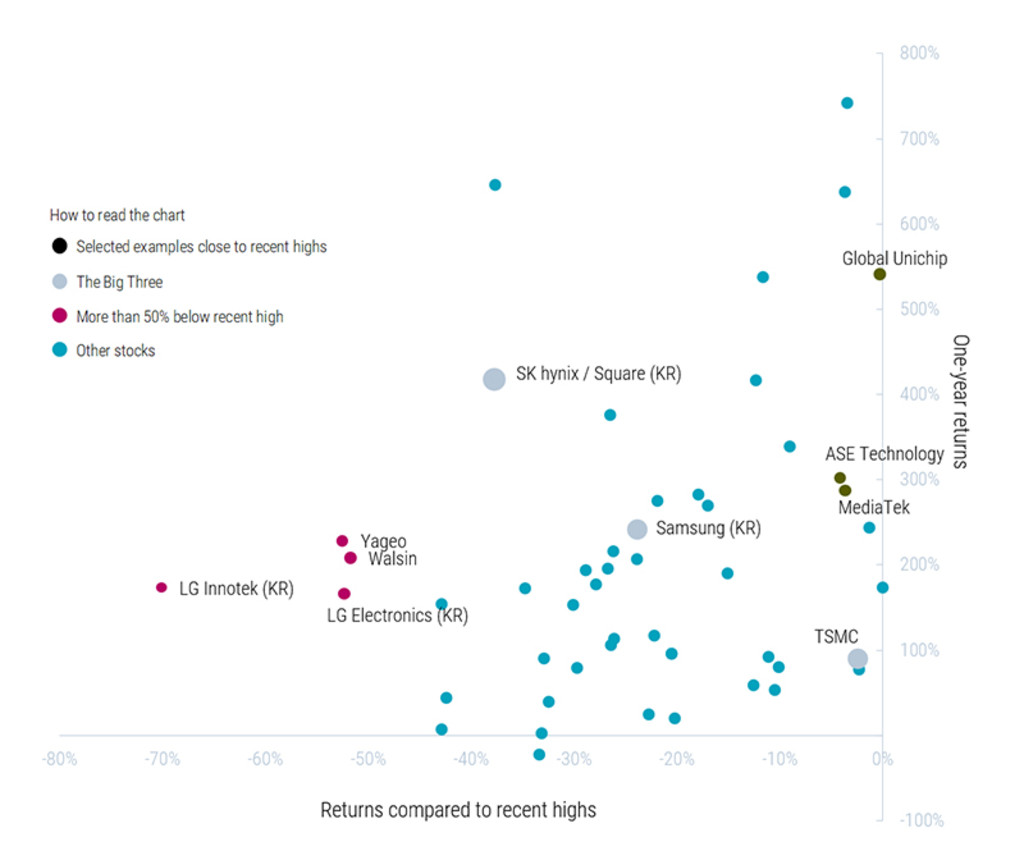
Past performance does not guarantee future results. The value of your investments will fluctuate. Companies named and shown are for illustrative purposes only. No inference can be made about their future development. This is not a buy, sell or hold recommendation. Source: Robeco analysis; Bloomberg.1 One-year share-price returns and declines from recent highs for 51 companies in the Asian AI hardware value chain. All figures as of 24 September 2026.
The scatter makes that divergence visible. MediaTek2, ASE Technology and Global Unichip, three sizable companies at the heart of the AI boom, remained within 5% of their recent highs, supported by order growth and earnings momentum. LG Innotek, LG Electronics, Yageo and Walsin were more than 50% below their peaks, despite positive one-year returns for all four.
The value chain behind the dispersion
The ten-step framework in Figure 2 helps explain the spread. AI hardware moves from chip design through foundries, memory, substrates, packaging and testing, and then into networking, power and cooling, components, boards and complete servers. Companies at each stage face different demand cycles, competitive pressures and starting valuations. Exposure to the same spending boom can therefore produce very different earnings and share-price outcomes.
Figure 2 | The ten steps of the Asian AI hardware value chain
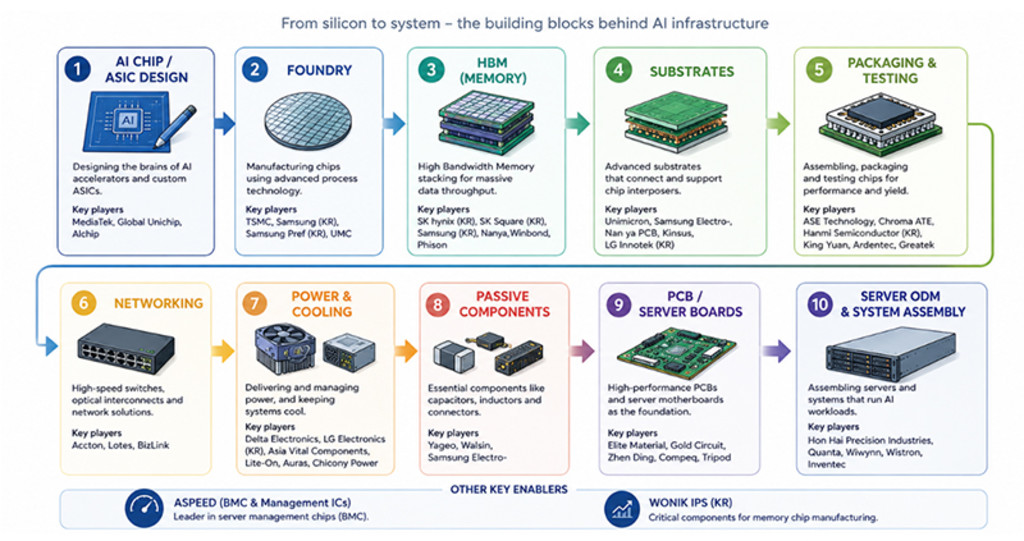
Source: Robeco. This framework is one of several possible classifications of the AI hardware value chain. It focuses on the main Taiwanese and Korean players; companies from Japan, China and the US also compete across the chain.
Why stock selection matters
For investors, identifying an AI beneficiary is only the starting point. The harder question is how much future growth the share price already reflects. A healthy AI business can still disappoint when expectations move too far ahead of earnings. Strong earnings revisions, by contrast, can support further gains after a large rally.
Robeco’s emerging markets quant strategies seek to capture these differences through many bottom-up stock-level decisions, while keeping overall country and sector exposures balanced. Indeed, so far in 2026, technology stock selection has contributed positively without an overall overweight to AI-related names.
Footnotes
1Source: The following are trademarks and service marks of Bloomberg Finance L.P., a Delaware limited partnership, or its subsidiaries: BLOOMBERG, BLOOMBERG ANYWHERE, BLOOMBERG MARKETS, BLOOMBERG NEWS, BLOOMBERG PROFESSIONAL, BLOOMBERG TERMINAL and BLOOMBERG.COM: Absence of any trademark or service mark from this list does not waive Bloomberg's intellectual property rights in that name, mark or logo. All rights reserved.
2Companies named and shown are for illustrative purposes only. No inference can be made about their future development. This is not a buy, sell or hold recommendation.

Explore our EM quant strategies
重要事項
当資料は情報提供を目的として、ロベコ・ジャパン株式会社(以下「当社」)が独自に作成、または当社のグループ会社(Robeco Institutional Asset Management B.V.およびその関連会社を含む)から提供された資料を当社が編集・翻訳したものです。資料中の個別の金融商品の売買の勧誘や推奨等を目的とするものではありません。記載された情報は十分信頼できるものであると考えておりますが、その正確性、完全性を保証するものではありません。意見や見通しはあくまで作成日における弊社の判断に基づくものであり、今後予告なしに変更されることがあります。運用状況、市場動向、意見等は、過去の一時点あるいは過去の一定期間についてのものであり、過去の実績は将来の運用成果を保証または示唆するものではありません。また、記載された投資方針・戦略等は全ての投資家の皆様に適合するとは限りません。当資料は法律、税務、会計面での助言の提供を意図するものではありません。 ご契約に際しては、必要に応じ専門家にご相談の上、最終的なご判断はお客様ご自身でなさるようお願い致します。 運用を行う資産の評価額は、組入有価証券等の価格、金融市場の相場や金利等の変動、及び組入有価証券の発行体の財務状況による信用力等の影響を受けて変動します。また、外貨建資産に投資する場合は為替変動の影響も受けます。運用によって生じた損益は、全て投資家の皆様に帰属します。したがって投資元本や一定の運用成果が保証されているものではなく、投資元本を上回る損失を被ることがあります。弊社が行う金融商品取引業に係る手数料または報酬は、締結される契約の種類や契約資産額により異なるため、当資料において記載せず別途ご提示させて頂く場合があります。具体的な手数料または報酬の金額・計算方法につきましては弊社担当者へお問合せください。 当資料及び記載されている情報、商品に関する権利は弊社に帰属します。したがって、弊社の書面による同意なくしてその全部もしくは一部を複製またはその他の方法で配布することはご遠慮ください。 商号等: ロベコ・ジャパン株式会社 金融商品取引業者 関東財務局長(金商)第2780号 加入協会: 一般社団法人 資産運用業協会