Head of Conservative Equities and Chief Quant Strategist


• インサイト
Quant chart: Successfully reducing drawdowns
In investing, minimizing losses is crucial for long-term capital growth. This timeless truth is especially relevant today, with major stock market indices experiencing significant drawdowns. To illustrate this point, a 20% loss requires “only” a 25% gain to recover, while a 50% loss demands a staggering 100% rebound.
執筆者


Portfolio Manager


Researcher
主なキーワード
The Robeco Conservative Equities strategy is designed to win by losing less during market downturns. Over its nearly 20-year live track record, the global equity market has endured ten distinct episodes of drawdowns exceeding 10%, as illustrated in Figure 1.
Figure 1 | Real-life drawdown reduction during ten distinct market drawdowns
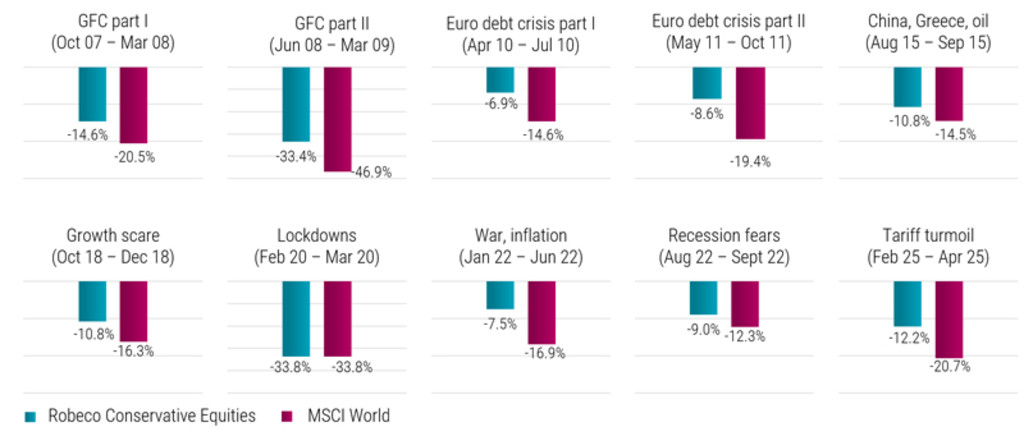
Past performance is no guarantee of future results. The value of your investment may fluctuate. Source: Robeco. The figure shows the maximum drawdowns of the Robeco Conservative Equities strategy versus the MSCI World Index during ten distinct market drawdown episodes since the start of the strategy in October 2006, as selected by Robeco. The length of the period is based on when MSCI World reached the pre-sell-off level (not yet reached again for the “tariff turmoil” scenario, for which the drawdowns are measured up to April 29, 2025). Drawdowns are measured based on daily data in EUR of the net asset value of the representative account Robeco QI Institutional Global Developed Conservative Equities strategy, gross-of-fees. In reality, costs such as management fees and other costs are charged. These have a negative effect on the returns shown.
Since then, the strategy has successfully navigated multiple periods of volatility, including the European debt crisis (2010/2011), the oil price shock (2015), and the growth scare of 2018, which, notably, was also linked to early tariff tensions under the Trump administration. These drawdown periods were followed by the first Covid-19 lockdown (2020), stagflation concerns (2022), and the ongoing tariff turmoil (2025). While the current episode is still evolving, recent uncertainty surrounding central bank independence has further unsettled investors.
Across all these ten market corrections — with the exception of the first pandemic lockdown — the Robeco Conservative Equities strategy delivered the expected downside protection. More specifically, while the MSCI World Index experienced an average drawdown of 21.6%, the Robeco strategy averaged just a 14.8% drawdown, reducing relative risk by more than 30%. The ability to limit loss highlights the strategy’s effectiveness in preserving capital and supporting long-term compounding.
Although the strategy may lag during strong bull markets, its consistent downside protection has contributed to better long-term results. From its inception in October 2006 through March 2025 (excluding April data), the strategy has delivered an annualized return of 8.3%, compared to 7.8% for the MSCI World Index, both in EUR. Importantly, it has done so with significantly lower volatility — offering equity investors a smoother, more reassuring ride.
重要事項
当資料は情報提供を目的として、ロベコ・ジャパン株式会社(以下「当社」)が独自に作成、または当社のグループ会社(Robeco Institutional Asset Management B.V.およびその関連会社を含む)から提供された資料を当社が編集・翻訳したものです。資料中の個別の金融商品の売買の勧誘や推奨等を目的とするものではありません。記載された情報は十分信頼できるものであると考えておりますが、その正確性、完全性を保証するものではありません。意見や見通しはあくまで作成日における弊社の判断に基づくものであり、今後予告なしに変更されることがあります。運用状況、市場動向、意見等は、過去の一時点あるいは過去の一定期間についてのものであり、過去の実績は将来の運用成果を保証または示唆するものではありません。また、記載された投資方針・戦略等は全ての投資家の皆様に適合するとは限りません。当資料は法律、税務、会計面での助言の提供を意図するものではありません。 ご契約に際しては、必要に応じ専門家にご相談の上、最終的なご判断はお客様ご自身でなさるようお願い致します。 運用を行う資産の評価額は、組入有価証券等の価格、金融市場の相場や金利等の変動、及び組入有価証券の発行体の財務状況による信用力等の影響を受けて変動します。また、外貨建資産に投資する場合は為替変動の影響も受けます。運用によって生じた損益は、全て投資家の皆様に帰属します。したがって投資元本や一定の運用成果が保証されているものではなく、投資元本を上回る損失を被ることがあります。弊社が行う金融商品取引業に係る手数料または報酬は、締結される契約の種類や契約資産額により異なるため、当資料において記載せず別途ご提示させて頂く場合があります。具体的な手数料または報酬の金額・計算方法につきましては弊社担当者へお問合せください。 当資料及び記載されている情報、商品に関する権利は弊社に帰属します。したがって、弊社の書面による同意なくしてその全部もしくは一部を複製またはその他の方法で配布することはご遠慮ください。 商号等: ロベコ・ジャパン株式会社 金融商品取引業者 関東財務局長(金商)第2780号 加入協会: 一般社団法人 資産運用業協会