Analyst
• インサイト
Power play - sizing up transition risk for electric utilities
As the energy transition accelerates, it is easy for companies to make ambitious pledges. Robeco’s utility sector SDP model can help investors distinguish those which are actually credible.
執筆者


Sector Lead
まとめ
- Electric utilities are carbon-intensive
- Sector decarbonization pathways (SDPs) help assess transition risk
- SDP models illuminate future leaders and laggards among electric utilities
To keep global temperatures in line with the Paris Agreement, electric utilities must lower their emissions. As energy demand shifts toward more sustainable sources, it is increasingly critical for investors to understand how power utilities are adapting their strategies and the impact on their portfolios.
The Power Sector Decarbonization Pathway (SDP) measures whether companies are setting the necessary targets and making the needed investments to ensure they are keeping pace with the net- zero transition.
The SDP model focuses on three key areas:
Assessing utilities’ future decarbonization trajectories against science-based benchmarks
Analyzing of required capex for renewables to reach benchmark targets
Comparing companies’ required capex with committed capex to determine the credibility of their décarbonation plans
Analyses are conducted for publicly listed utilities within the investment universes of our sustainable equity and credit investment strategies. The results help quantify and objectively forecast the probable decarbonization trajectory each utility will make in the coming decades. Investors can then compare and rank utilities against peers to distinguish the likely laggards and leaders in the power sector through 2050.
Science-based benchmarks
We chose the Transition Pathway Initiative (TPI) Below 2°C Pathway as the emission-reduction benchmark for the electric utility sector. The TPI integrates the latest climate science and emissions data from the IPCC and the IEA and is considered the world’s foremost institution for developing sector-specific decarbonization pathways. It tracks the year-by-year reductions that the power sector must make in order to ensure global temperatures stay well below the 2°C limit set by the Paris Agreement.
Commitment pathways are forward-looking trajectories that plot the emission reductions a utility company has pledged to make in the coming years and decades. Figure 1 shows the pledged emission reduction commitments of an illustrative utility (the Commitment Pathway) versus those needed to be Paris-aligned (the TPI Below 2°C Pathway).
Figure 1 – A utility’s projected decarbonization trajectory vs the benchmark

Source: Robeco, 2023. The graphic is for an illustrative electric utility company. The company’s pledged decarbonization targets (the Company Commitment Pathway) are denoted by the dotted red line. The solid green line is the Sector Benchmark Pathway which denotes the emission reductions required to reach the TPI Below 2°C temperature scenarios by 2050.
The decarbonization score
A utility’s decarbonization performance is measured by the size of the gap between the Commitment Pathway and the TPI Below 2°C Pathway over the short (2025-2028), mid (2030-2040), and long term (2050). The larger the gap, the worse the utility’s current and projected decarbonization performance. Companies with small, zero or negative gaps (meaning company commitments are better than those required by the benchmark) are considered good to outstanding performers.
These companies receive high, positive decarbonization scores on a scale of 1-100 (100=highest). Conversely, those whose disclosed emission targets fail to meet required decarbonization levels receive lower scores.
Though the size of gaps is important, timing also matters. We attach particular significance (and weight) to a company’s commitments and actions in the mid term, from 2030-2040. This decade will be a critical window for implementing significant emission reductions to limit global warming to well below 2°C. This urgency is based on scientific evidence indicating that delaying significant emission reductions until after 2040 would make it increasingly difficult, if not impossible, to avoid the most catastrophic impacts of climate change.1
Robeco decarbonization score = (0.25) current score + (0.20) short-term score + (0.45) mid-term score + (0.10) long-term score
Evaluating capital expenditures toward renewable capacity
Though disclosed decarbonization strategies are a positive sign, company commitments must also be credible. To measure credibility, we look at a utility’s allocated capital spending (capex) on future renewable and low-emission technologies and compare it to what they should be spending to align with the TPI-benchmark. To do this we calculate the investments into low-emission electric power capacity (i.e., renewables and nuclear) that would be needed to replace the emissions produced by fossil-based technologies within a given period.2
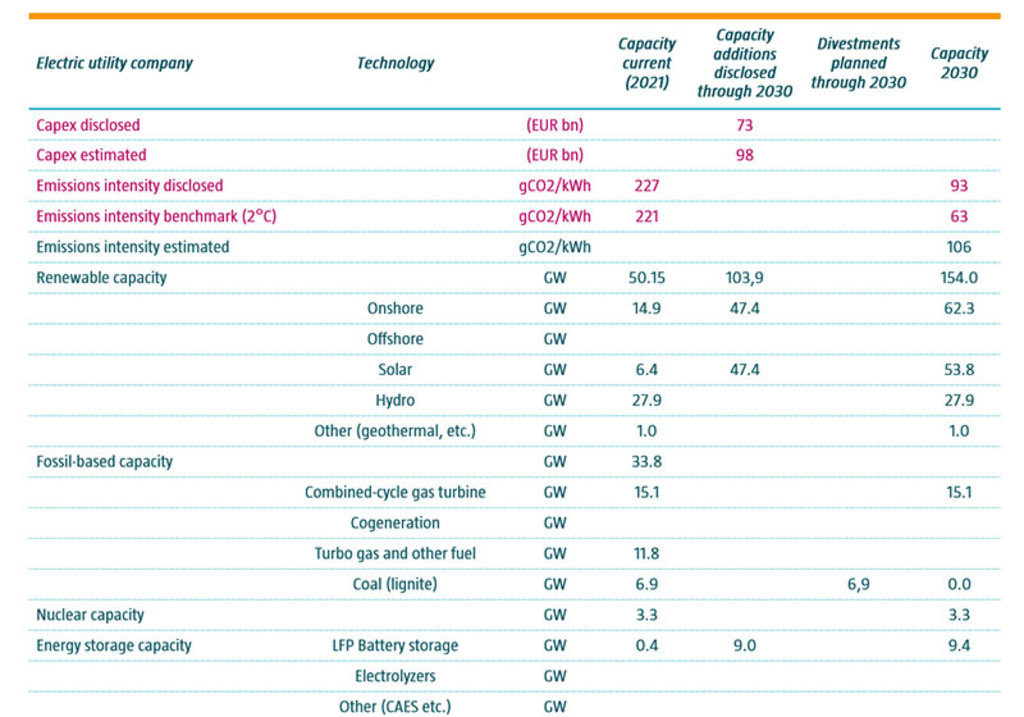
For companies which currently have a higher carbon intensity than the benchmark, we estimate the low-emission capex investments required to reach the TPI benchmark intensity. For companies whose targets are already more ambitious than the benchmark, we estimate the capex required to reach the company’s own decarbonization targets. Table 1 shows the results of our analysis on an electric utility. In 2021, its emissions intensity (227 gCO2/kWh) was only slightly higher than the TPI 2°C benchmark (221 gCO2/kWh), making it a sector leader. In 2030, the utility has pledged to bring emission intensities down a further 60% (from 227 to 93 gCO2/kWh, 59%) which is not quite in line with the benchmark (63 gCO2/kWh) but still more ambitious than most peers.
Table 1: Capex modeling results for an electric utility
Source: Robeco, 2023
Despite well-meaning plans, according to our calculations, the company would need to allocate capex of EUR 98 billion to reach this ambitious target, versus the planned EUR 73 billion announced by the company (a capex deficit of EUR 25 billion). Such a large deficit calls into question the credibility of the company’s emission reduction plans.
Still, the company has enough capex allocated to easily reach benchmark targets. This, combined with its early emission reductions, means that at present it is an early transition leader and likely to remain so through 2030 and beyond.
Conclusion
While the majority of analyzed utilities can cover the costs of financing pledged decarbonization commitments, they failed to align with the financing needed to reach the TPI Below 2°C decarbonization targets. Insufficient capex toward low-emission technology now could lead to unexpected capital outlays that could raise costs down the road. In addition to capital cost increases, utilities that fail to make the necessary investments are more likely to be hit by regulatory fines and face reputational damage from not acting fast enough.
As the transition accelerates and governments press to keep their own national climate commitments, there is an increasing risk of potential devaluation of high-emission physical assets such as coal- or gas-fired power plants. These risks translate into the potential for reduced dividends, share price depreciation, and the overall underperformance as energy markets transition to net zero.
Given these material risks, the Sector Decarbonization Pathway model for utilities can be a valuable tool for helping investors stay attuned to which companies are emerging as early transition leaders and which are likely to expose portfolios to transition risk.
Footnotes
1 Scores are designed to be comparable across sectors. A high score for a steel or utility company means they are fully aligned with their respective sectors' decarbonization pathways. It does not mean that they have the same carbon intensity.
2This method of calculating the associated capex of clean power capacity is based on IEA price estimations for 1 gigawatt (GW) of capacity for the different renewable technologies.
サステナビリティに関する最新のインサイトを把握
ロベコのニュースレター(英文)に登録し、サステナブル投資の最新動向を探求しましょう。
重要事項
当資料は情報提供を目的として、ロベコ・ジャパン株式会社(以下「当社」)が独自に作成、または当社のグループ会社(Robeco Institutional Asset Management B.V.およびその関連会社を含む)から提供された資料を当社が編集・翻訳したものです。資料中の個別の金融商品の売買の勧誘や推奨等を目的とするものではありません。記載された情報は十分信頼できるものであると考えておりますが、その正確性、完全性を保証するものではありません。意見や見通しはあくまで作成日における弊社の判断に基づくものであり、今後予告なしに変更されることがあります。運用状況、市場動向、意見等は、過去の一時点あるいは過去の一定期間についてのものであり、過去の実績は将来の運用成果を保証または示唆するものではありません。また、記載された投資方針・戦略等は全ての投資家の皆様に適合するとは限りません。当資料は法律、税務、会計面での助言の提供を意図するものではありません。 ご契約に際しては、必要に応じ専門家にご相談の上、最終的なご判断はお客様ご自身でなさるようお願い致します。 運用を行う資産の評価額は、組入有価証券等の価格、金融市場の相場や金利等の変動、及び組入有価証券の発行体の財務状況による信用力等の影響を受けて変動します。また、外貨建資産に投資する場合は為替変動の影響も受けます。運用によって生じた損益は、全て投資家の皆様に帰属します。したがって投資元本や一定の運用成果が保証されているものではなく、投資元本を上回る損失を被ることがあります。弊社が行う金融商品取引業に係る手数料または報酬は、締結される契約の種類や契約資産額により異なるため、当資料において記載せず別途ご提示させて頂く場合があります。具体的な手数料または報酬の金額・計算方法につきましては弊社担当者へお問合せください。 当資料及び記載されている情報、商品に関する権利は弊社に帰属します。したがって、弊社の書面による同意なくしてその全部もしくは一部を複製またはその他の方法で配布することはご遠慮ください。 商号等: ロベコ・ジャパン株式会社 金融商品取引業者 関東財務局長(金商)第2780号 加入協会: 一般社団法人 資産運用業協会