Robeco, The Investments Engineers
blue circle

19-08-2021 · Column

The CO₂lumnist: Market versus location-based scope 2 emissions

Investors rely on data to make decisions on climate strategy, but emissions data can have smoke coming out of the ears of frustrated investors. In the third of a new series of columns taking a more light-hearted look at the issue, Robeco data scientist Thijs Markwat makes the case for paying more attention to scope 2.

    執筆者

  • Thijs Markwat - Climate Data Scientist

    Thijs Markwat

    Climate Data Scientist

Many carbon discussions at the moment are about the quality and inclusion of scope 3 or which denominator to use in normalizing footprints. However, I think that scope 2 should also deserve some more attention. First let me start with a very quick recap:

  • Scope 1 are the direct emissions that come from the company by burning fossil fuels

  • Scope 2 are the emissions that stem from electricity purchased from utility providers1

  • Scope 3 emissions are all the other indirect emissions that occur along the value chain.

Thus, scope 2 are indirect emissions from electricity that is generated somewhere else. Depending on how this electricity was generated, these emissions can be higher or lower. According to the Greenhouse Gas Protocol, there are two methods available for calculating the carbon footprint of scope 2 emissions:

  • Market-based (MB): emissions calculated using emission factors from contractual instruments

  • Location-based (LB): emissions calculated using the average emissions intensity of the grid.

Thus, LB scope 2 reflects what you physically get via the electricity grid, and MB scope 2 reflects what you have actually purchased. Next, we will look at how MB and LB scope 2 are empirically related. We use company reported data from CDP for the analysis. In total there are 2708 companies that report their LB scope 2. Of those, 1516 companies (56%) also reports a MB scope 2. Big companies tend to report MB scope 2 more often than small companies. The chart below shows a scatter plot between LB and MB scope 2 for all companies that report both types of scope 22.

image.png

On the bottom of the chart we see companies that have a substantial LB scope 2 but a zero MB scope 2. Those companies generally have settled contracts with renewabe energy providers, or have offset emissions via contracts with other parties. The grey line indicates an equal MB and LB scope 2.

Of all companies, 71% report a lower MB scope 2, 21% report a higher MB scope 2, and 7% report exactly the same number for MB and LB. At first I found it pretty striking that 21% of the companies report a higher MB than LB scope 2. I always had this supposition that MB scope 2 should be lower than LB scope 2, as I would simply not expect a company to buy dirtier electricity than what it physically gets delivered via the grid. But then I realized that of course not everybody can buy cleaner energy than the average.

Even more, I might actually be starting to take the opposite view, and wonder why by far the most mass in the chart is below the diagonal. If most companies seem to use a much cleaner electricity mix than the average, then who is using the dirtier electricity? Of course, there will be a reporting bias, with cleaner companies more prone to also report MB scope 2. In addition, it could be that small business, households and governments are net users of the dirtier energy.

Furthermore, there might be some error in reporting. For instance, it is suspicious that for 7% of the companies the MB and LB scope 2 are exactly equal. All in all, I would say that really understanding MB scope 2 is not directly straightforward, and also for scope 2 there are still many questions to resolve.

Footnotes

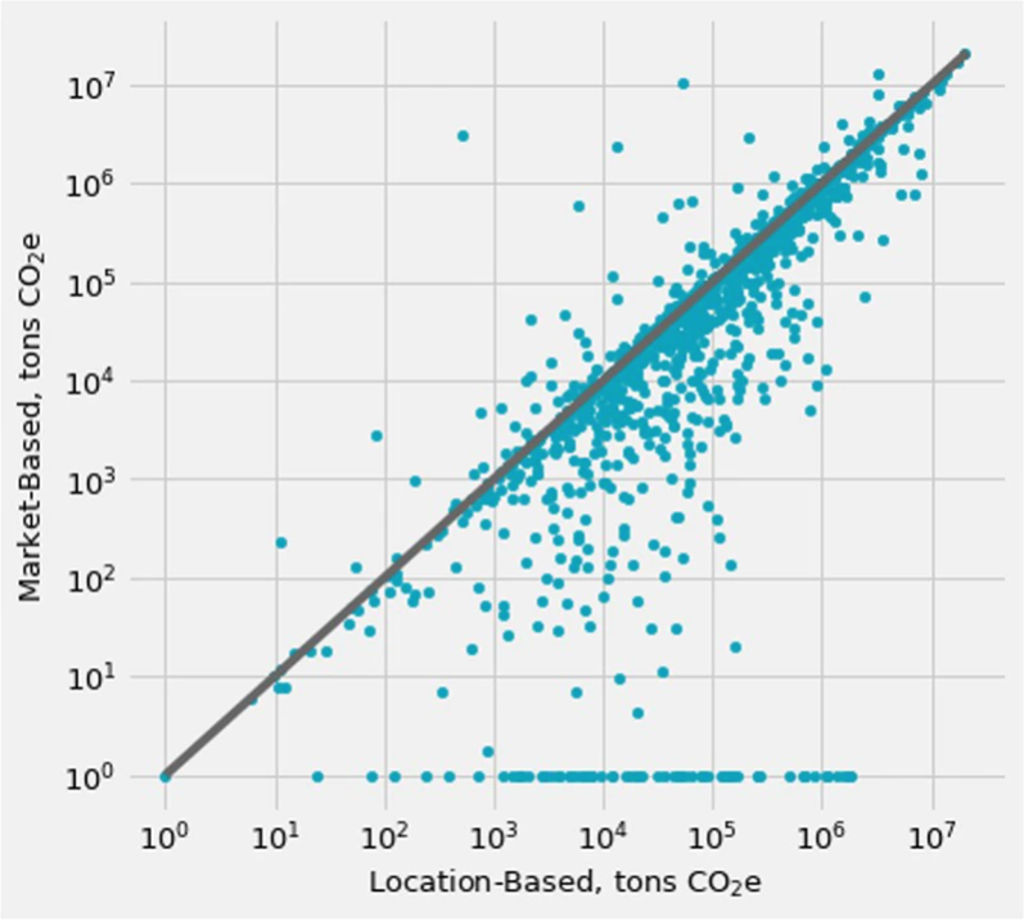
1Purchased steam, heat, or cooling are also scope 2, but for this note we focus on electricity.
2The chart shows 1 + emissions as we needed to plot zero emission values on a log scale.

サステナビリティに関する最新の「インサイト」を読む

ロベコのニュースレターにご登録いただくことで、いち早く最新のインサイトを入手し、環境に優しいポートフォリオの構築にお役立てください。

最新情報を受け取る

重要事項

当資料は情報提供を目的として、Robeco Institutional Asset Management B.V.が作成した英文資料、もしくはその英文資料をロベコ・ジャパン株式会社が翻訳したものです。資料中の個別の金融商品の売買の勧誘や推奨等を目的とするものではありません。記載された情報は十分信頼できるものであると考えておりますが、その正確性、完全性を保証するものではありません。意見や見通しはあくまで作成日における弊社の判断に基づくものであり、今後予告なしに変更されることがあります。運用状況、市場動向、意見等は、過去の一時点あるいは過去の一定期間についてのものであり、過去の実績は将来の運用成果を保証または示唆するものではありません。また、記載された投資方針・戦略等は全ての投資家の皆様に適合するとは限りません。当資料は法律、税務、会計面での助言の提供を意図するものではありません。 ご契約に際しては、必要に応じ専門家にご相談の上、最終的なご判断はお客様ご自身でなさるようお願い致します。 運用を行う資産の評価額は、組入有価証券等の価格、金融市場の相場や金利等の変動、及び組入有価証券の発行体の財務状況による信用力等の影響を受けて変動します。また、外貨建資産に投資する場合は為替変動の影響も受けます。運用によって生じた損益は、全て投資家の皆様に帰属します。したがって投資元本や一定の運用成果が保証されているものではなく、投資元本を上回る損失を被ることがあります。弊社が行う金融商品取引業に係る手数料または報酬は、締結される契約の種類や契約資産額により異なるため、当資料において記載せず別途ご提示させて頂く場合があります。具体的な手数料または報酬の金額・計算方法につきましては弊社担当者へお問合せください。 当資料及び記載されている情報、商品に関する権利は弊社に帰属します。したがって、弊社の書面による同意なくしてその全部もしくは一部を複製またはその他の方法で配布することはご遠慮ください。 商号等: ロベコ・ジャパン株式会社  金融商品取引業者 関東財務局長(金商)第2780号 加入協会: 一般社団法人 日本投資顧問業協会