
Head of Solutions Research


概要
- The emerging markets debt (EMD) asset class has surpassed USD 8 tln mark
- Local-currency EMD had a lost decade due to a strong US dollar, but is currently valued cheaply
- Both hard-currency and local-currency EMD can be attractive additions to multi-asset portfolios
All EMD segments had a stellar performance until the taper tantrum in 2013, when they started underperforming. The sluggish performance of the past decade is likely not representative of the coming years, when both the hard- and local-currency sovereign segments can be attractive diversifiers relative to conventional asset classes.
Figure 1 - Development of the market capitalization of emerging markets debt by segment
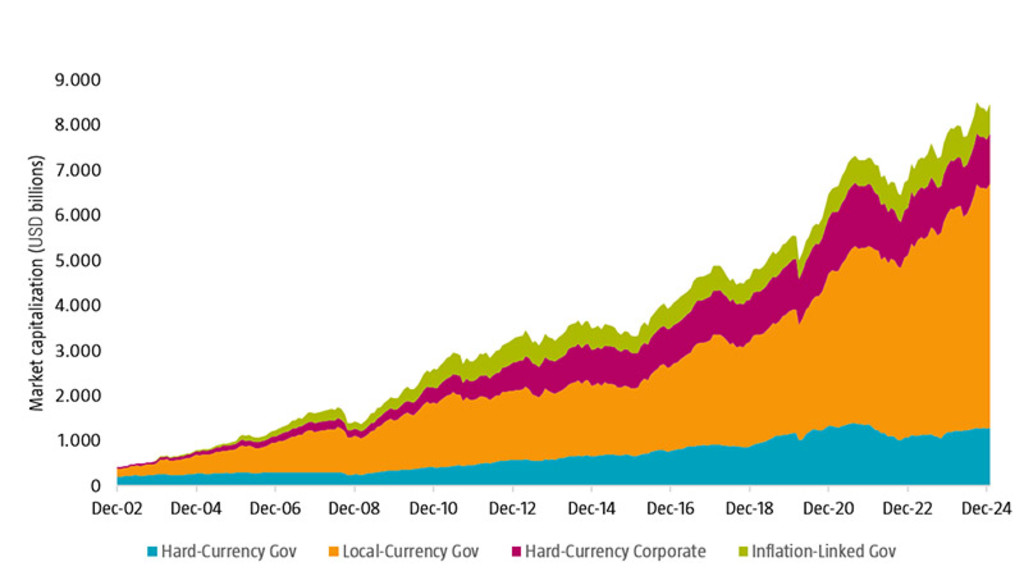
Source: Robeco, JP Morgan, Bloomberg.
EMD as an asset class has grown spectacularly over the past two decades, reaching a market capitalization above USD 8 tln at the end of 2024, about 11% of the global bond market. 1,2 Figure 1 shows that the local-currency government bond segment has grown the fastest and it is currently valued at more than USD 5 tln in terms of the used market value definition. The hard-currency government segment has not grown as much and has hovered around USD 1 tln for a couple of years. Many large countries, such as Brazil, China, and India have been able to issue government debt in local currency, meaning they no longer rely solely on the narrower hard-currency funding. Hard-currency corporate debt has also surpassed USD 1 tln, while inflation-linked debt in emerging markets is currently about half of that. To put this in perspective, the global corporate high yield market is about USD 2 tln.
The growth of local-currency markets is primarily due to a few large countries that dominate the capitalization-weighted market. Moreover, several countries have capital controls that make it cumbersome to invest in their government bond markets for international investors. To reduce these challenges, benchmark indices are often constrained to those countries with sufficiently accessible and tradable bond markets. Additionally, the weight in the most widely used EMD indices is capped at 10% for local-currency markets and 5% for hard-currency markets that tend to have somewhat more risky constituents.3 The USD 8 trn from Figure 1 drops to USD 3 tln after these adjustments have been made. Figure 2 shows the average returns and volatility risk over the period January 2003 (the first month we have returns of the local-currency EMD segment) to January 2025.4 For the purpose of comparison we have included conventional asset classes that make up most of the global market portfolio.
Figure 2 – Average returns and volatility risk, January 2003 to January 2025
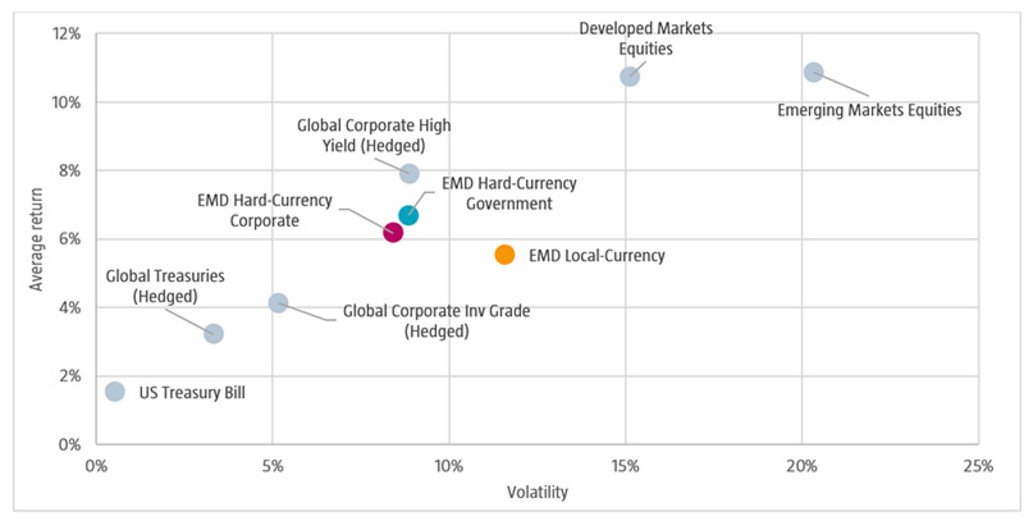
Source: Robeco, JP Morgan, Bloomberg, MSCI. Returns and volatility annualized from monthly data. Returns in US dollars.
Figure 2 shows that global corporate high yield and developed equity markets have performed exceptionally well over this period. The returns of hard-currency EMD, both government and corporate, are in line, but unhedged local-currency EMD has performed poorly compared to its volatility risk.
The added value of emerging markets debt segments for a multi-asset portfolio
Multi-asset investors often focus on how new asset classes affect a portfolio that consists of conventional asset classes such as global treasuries, investment grade credits, and developed and emerging equity markets. In the case of emerging markets debt, a comparison with the global corporate high yield bond market may be relevant, as this asset class is also often considered unconventional, i.e. not part of a regular benchmark. The benchmark portfolio has a 50% weight to global bond markets and a 50% weight to global equity markets.5 As emerging debt markets tend to be riskier, we decided to finance the 20% allocation by selling 12% from the global bond and 8% from the global equity portfolios aiming to maintain a similar overall portfolio risk. We do this for each of the three emerging debt segments separately, as well as an equal-weighted combination of 5% in the three emerging debt segments and 5% in corporate high yield.
Figure 3 shows the rolling three-year excess returns of the portfolios containing the three EMD segments and corporate high yield. Excess returns were positive in the first part of the sample, especially for the local-currency segment. A large part of the excess return can be explained by the weakening of the US dollar against emerging markets currencies. However, the tides turned after the ‘taper tantrum’ by Federal Reserve president Ben Bernanke in 2013. After that, the EMD segments only occasionally showed (small) outperformances on a three-year horizon with the hard-currency segment outperforming around 2016-2017. Given the differences in performance over time between local- and hard-currency debt, the equal-weighted basket shows that a combination of the segments leads to more stable excess returns. However, based on past 10-year performance, emerging markets debt detracted value from a multi-asset portfolio.
Figure 3 – Rolling three-year excess performance from adding alternative fixed income segments
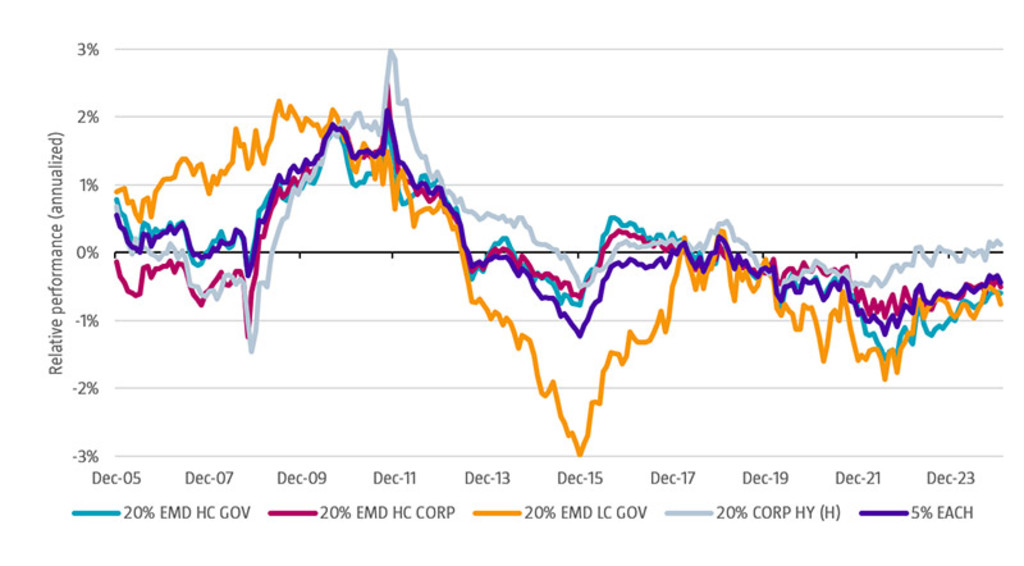
Source: Robeco, JP Morgan, Bloomberg, MSCI. Returns and volatility annualized from monthly data. Returns in US dollars. This analysis is based on historical research and does not reflect actual performance of any investment product or strategy. It is intended for illustrative purposes only.
Expected returns on emerging markets currencies essential
Currency returns are the most important driver of the local-currency EMD segment, showing a 0.95 correlation with total returns. A possible indicator of long-term expected currency returns is their valuation and a common valuation metric is the real exchange rate, which is derived from purchasing power parity. Emerging currencies were relatively cheap in 2003 and as a group strengthened versus the US dollar by 35% in the decade afterwards. However, most of this was lost over the past decade, and we are currently close to 2003 levels of currency valuation. Although there are many factors that can affect relative currency strength, an attractive starting valuation tends to predict higher future returns. Thus, for the local-currency EMD segment, investors need to form a view on the expected currency returns compared to the yield pickup, as the currency volatility may reduce the portfolio’s Sharpe ratio.
Diversification of default risk drivers
Given the absence of direct currency risk in the hard-currency EMD segment, we find its total returns are highly correlated with other ‘US risk-free yield plus default spread’ segments, such as corporate investment grade and high yield bonds. The risk-free yield component is shared by these segments, and therefore movements in the US Treasury curve affect each segment similarly. Over the past two decades, the credit spreads of the hard-currency EMD segment have also moved in line with that of corporate bonds in developed markets, suggesting that these credit markets are largely integrated. Even though past correlation has been high, it is important to realize that the fundamental drivers of credit risk are very different. The default probability of a globally diversified group of more than 70 issuing emerging governments is not directly linked to that of corporates in developed countries, although global business cycle risk may affect both at the same time. The credit rating distribution shows that this asset class is more comparable to corporate investment grade, whereas the spread levels and thus overall return indicate that it acts more like high yield bonds. This characteristic warrants the consideration of this asset class in a portfolio context from a risk-return perspective.
Country selection within emerging markets debt
So far, we have considered only the entire local- and hard-currency emerging debt segments. There are considerable differences in yield, maturity, and macroeconomic exposures within these segments that skilled investors can exploit by investing only in a subset of bonds from countries with a better reward for the risk. In that selection process the sustainability profile of the issuers can also be considered, such that the emerging markets debt portfolio matches the investor’s investment philosophy and adds value to their portfolio. 6
For a more detailed analysis on each of the emerging markets debt segments, see Giesta de Mello Fernandes and Swinkels (2025), Exploring emerging markets debt: Bond voyage?, Journal of Asset Management.
Footnotes
1 This value is derived from adding the market value of the broadest EM debt indices provided by JP Morgan per segment: JP Morgan EMBI Global, JP Morgan GBI-EM Broad, and JP Morgan CEMBI Broad. The exception is the inflation-linked segment where the index is provided by Bloomberg: the Bloomberg EM Govt IL All Mats.
2 We assume the Bloomberg Global Aggregate Index to be the proxy for the overall global bond market.
3 These indices are the JP Morgan GBI-EM Global Diversified for local-currency sovereigns and the JP Morgan EMBI Global Diversified for hard-currency sovereigns.
4 We leave the inflation-linked bond segment out, because it is the smallest and dominated by two issuers: Brazil and Mexico.
5 To be more precise, the Bloomberg Global Aggregate Index (hedged to US dollars) and the MSCI All Countries World Index (in US dollars).
6 For more on sustainability, see the publication Sovereign sustainability: The two lenses applied by Robeco
信貸投資的新動態
訂閱我們的電子報,緊跟最新的信貸投資趨勢。
Important information
The contents of this document have not been reviewed by the Securities and Futures Commission ("SFC") in Hong Kong. If you are in any doubt about any of the contents of this document, you should obtain independent professional advice. This document has been distributed by Robeco Hong Kong Limited (‘Robeco’). Robeco is regulated by the SFC in Hong Kong. This document has been prepared on a confidential basis solely for the recipient and is for information purposes only. Any reproduction or distribution of this documentation, in whole or in part, or the disclosure of its contents, without the prior written consent of Robeco, is prohibited. By accepting this documentation, the recipient agrees to the foregoing This document is intended to provide the reader with information on Robeco’s specific capabilities, but does not constitute a recommendation to buy or sell certain securities or investment products. Investment decisions should only be based on the relevant prospectus and on thorough financial, fiscal and legal advice. Please refer to the relevant offering documents for details including the risk factors before making any investment decisions. The contents of this document are based upon sources of information believed to be reliable. This document is not intended for distribution to or use by any person or entity in any jurisdiction or country where such distribution or use would be contrary to local law or regulation. Investment Involves risks. Historical returns are provided for illustrative purposes only and do not necessarily reflect Robeco’s expectations for the future. The value of your investments may fluctuate. Past performance is no indication of current or future performance.