Chief Researcher
探索量化價值
訂閱我們的電子報,獲取尖端的量化策略和見解。


The 2018-2020 quant equity crisis posed an exceptional challenge to quantitative managers due to a rare combination of circumstances. There was basically only one way to outperform during this period, investing in the largest and most expensive growth stocks. Meanwhile, established factors were only effective to the extent that they provided implicit exposure to the same large growth equities. Thus, there were numerous ways to fail during the 2018-2020 period, but essentially only one way to succeed.
The recent quant equity crisis is commonly attributed to the underperformance of the value factor, which is a key pillar in many quantitative stock selection models. However, value is just one of the factors used by quantitative investors. Therefore, one can wonder why other factors apparently failed to offset, or provide more protection against the losses of the value factor.
In order to address this question, we conduct a detailed analysis of factor performance during the quant equity crisis, which we define as the period from June 2018 to August 2020. Figure 1 illustrates that value experienced a severe drawdown, while the size and investments factors also charted in negative territory. The latter result is not surprising, given that the investment and value effects are known to be closely related.1 On the other hand, the profitability and momentum factors fared relatively well during the period.
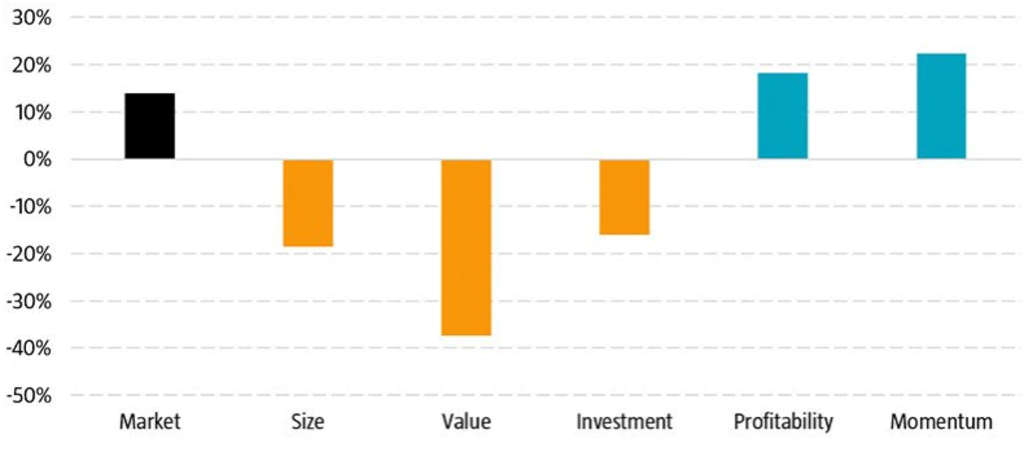
Source: Data library of Professor Kenneth French. Next to the capitalization-weighted market portfolio we consider the standard academic factors, size (SMB), value (HML), investment (CMA), profitability (RMW), and momentum (WML), as described in Fama and French (1993, 2015). The HML, CMA, RMW, and WML factors are based on 2x3 portfolios sorted independently on size and the target factor. All portfolios are capitalization weighted, and all returns are compounded total returns in US dollars. These returns reflect hypothetical, backtested portfolios which ignore costs, fees and taxes. Past returns are no guarantee for the future.
To better understand the drivers behind this factor performance, we look at the market-relative returns of portfolios sorted according to the various factors within different market-cap groups. As exhibited in Table 1, we observe that almost all the outperformance stemmed from investing in the largest stocks with particular factor characteristics.
Our research also challenges the notion that there was more than one way to outperform in the mega-cap space. We find that mega-cap profitability and momentum were essentially mega-cap growth in disguise. In fact, mega-cap top momentum and mega-cap top profitability portfolios behaved very similarly to the mega-cap growth portfolio, with the correlations between the monthly market-relative returns amounting to 75% and 89%, respectively.
訂閱我們的電子報,獲取尖端的量化策略和見解。
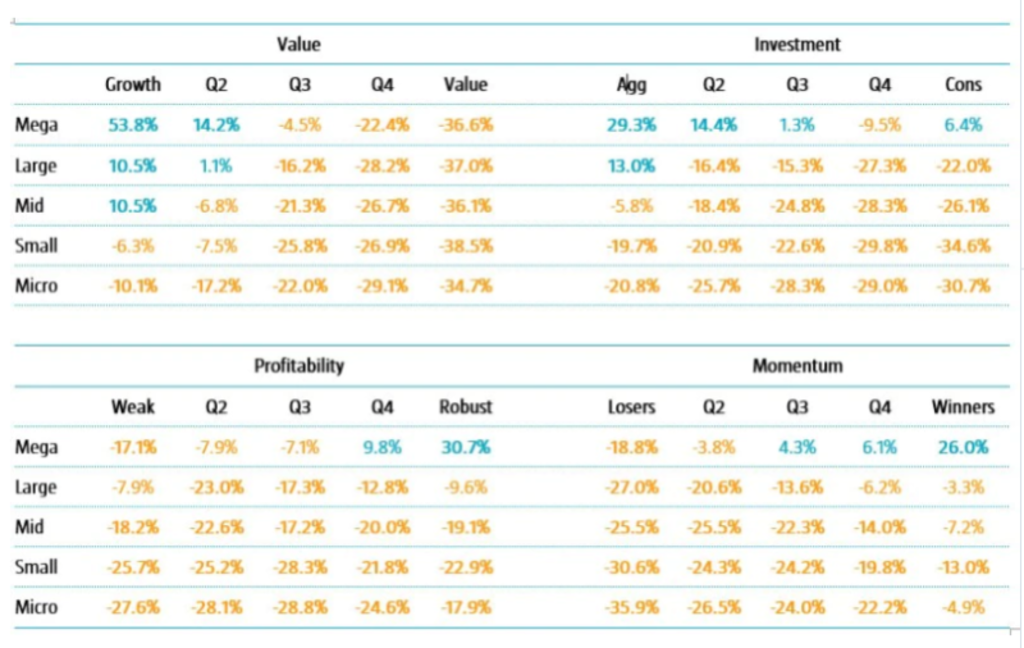
Source: Data library of Professor Kenneth French, Robeco. Next to the capitalization-weighted market portfolio we consider the standard academic factors, size (SMB), value (HML), investment (CMA), profitability (RMW), and momentum (WML), as described in Fama and French (1993, 2015). The factors are based on 5x5 independently sorted portfolios. All portfolios are capitalization weighted, and all returns are compounded total returns in US dollars. These returns reflect hypothetical, backtested portfolios which ignore costs, fees and taxes. Past returns are no guarantee for the future. Please note double-digit returns are highlighted in bold.
We conclude that there was basically only one way to outperform during this period, namely by investing in the largest and most expensive growth stocks. Indeed, our analysis shows that the mega-cap growth portfolio clearly had the strongest return as seen in Figure 2. This was the dominant phenomenon during the quant equity crisis, in which there were many ways to fail, but essentially only one way to succeed. This concentration of outperformance in one corner of the market and underperformance elsewhere is illustrated in Figure 2.
There were many ways to fail, but essentially only one way to succeed David Blitz


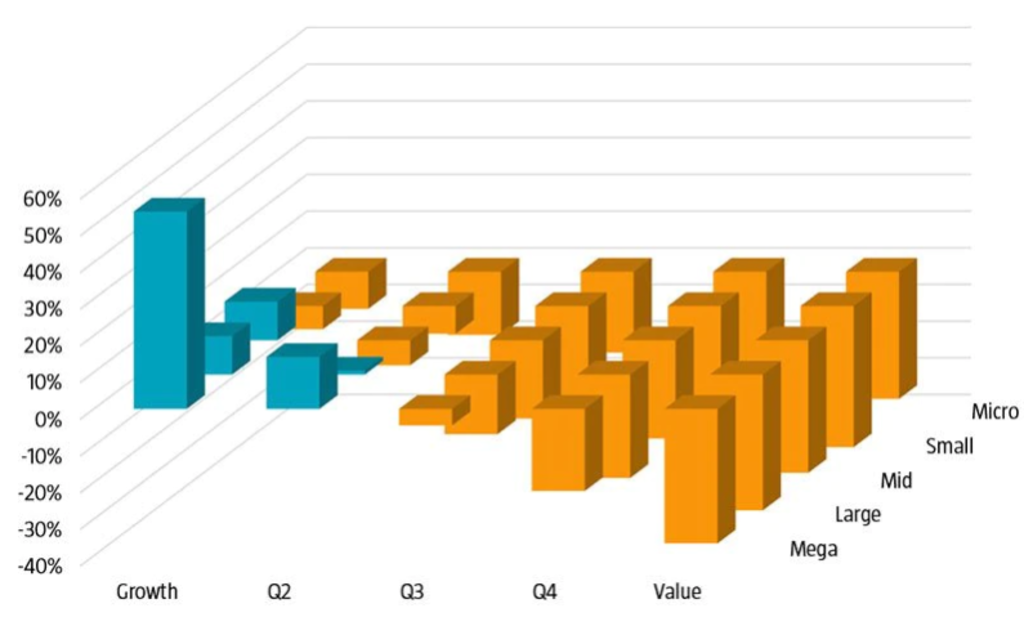
Source: Data library of Professor Kenneth French. Next to the capitalization-weighted market portfolio we consider the standard academic factors, size (SMB), value (HML), investment (CMA), profitability (RMW), and momentum (WML), as described in Fama and French (1993, 2015). The factors are based on 5x5 independently sorted portfolios. All portfolios are capitalization weighted, and all returns are compounded total returns in US dollars. These returns reflect hypothetical, backtested portfolios which ignore costs, fees and taxes. Past returns are no guarantee for the future.
We also compare the 2018-2020 episode with past major drawdowns of the value factor and find some notable differences. Most importantly, previous value drawdowns are better characterized as momentum rallies, because the outperformance of the momentum factor overshadowed the underperformance of the value factor. As a result, past value drawdowns did not necessarily cause quant equity crises.
Another important difference was the sharp underperformance of small stocks compared to their large peers. During previous value drawdowns, there were still opportunities for outperformance in smaller size segments. However, during 2018-2020, even the best-performing pockets in the small- and mid-cap space could not keep up with large growth stocks.
Apart from 2018-2020, there is actually only one other true quant equity crisis in our sample, which occurred during the strong market rebound seen in the first half of 2009. What the two crises have in common is that the main cause can be traced to one particular factor. In 2009, however, it was not the value factor but the momentum factor that crashed, due to a sharp recovery of the stocks that had suffered the largest losses during the 2008 debt crisis. Another notable difference with 2018-2020 is that the 2009 quant equity crisis was relatively short-lived. Factors resumed their upward trend within six months.
Some wonder whether the 2018-2020 quant equity crisis means factor-based investing is permanently impaired. In our view, the large losses on one factor, which were not offset by gains on other factors, do not imply a structural break, nor that factor premiums which have existed for many decades have disappeared all of a sudden. Therefore, we would summarize this period as an unusual combination of circumstances that culminated in a perfect storm for multi-factor investors, but also as an episode from which quantitative investment strategies can be expected to recover again in due course.
1See: Fama, E. F., and French, K. R., 2015. “A five-factor asset pricing model.” Journal of Financial Economics, 116(1), 1-22.
The contents of this document have not been reviewed by the Securities and Futures Commission ("SFC") in Hong Kong. If you are in any doubt about any of the contents of this document, you should obtain independent professional advice. This document has been distributed by Robeco Hong Kong Limited (‘Robeco’). Robeco is regulated by the SFC in Hong Kong. This document has been prepared on a confidential basis solely for the recipient and is for information purposes only. Any reproduction or distribution of this documentation, in whole or in part, or the disclosure of its contents, without the prior written consent of Robeco, is prohibited. By accepting this documentation, the recipient agrees to the foregoing This document is intended to provide the reader with information on Robeco’s specific capabilities, but does not constitute a recommendation to buy or sell certain securities or investment products. Investment decisions should only be based on the relevant prospectus and on thorough financial, fiscal and legal advice. Please refer to the relevant offering documents for details including the risk factors before making any investment decisions. The contents of this document are based upon sources of information believed to be reliable. This document is not intended for distribution to or use by any person or entity in any jurisdiction or country where such distribution or use would be contrary to local law or regulation. Investment Involves risks. Historical returns are provided for illustrative purposes only and do not necessarily reflect Robeco’s expectations for the future. The value of your investments may fluctuate. Past performance is no indication of current or future performance.