
PhD, Portfolio Manager Sustainable Index Solutions
探索量化價值
訂閱我們的電子報,獲取尖端的量化策略和見解。


Momentum had its ‘shot of momentum’ in 2020. But the ride was a bumpy one, while we also saw large return dispersions between different Momentum approaches. In this article, we examine the drivers behind the strong performance delivered by Momentum, how the factor can at times be exposed to significant style and concentration risks, and why we believe a well-diversified portfolio approach across Momentum signals is prudent to mitigate these risks.
Momentum was one of the top-performing factors in 2020. Indeed, the MSCI ACWI Momentum Index did not only significantly beat the MSCI ACWI, but it also outperformed most factor indices. It benefited from its material exposure to mega-cap growth stocks, in particular its large allocation to ‘big tech’. To this end, the MSCI ACWI Momentum and MSCI ACWI Growth Indices had material overweight exposures to seven of the ten largest stocks in the MSCI ACWI: namely Apple, Microsoft Corporation, Amazon, Tesla, Taiwan Semiconductor Manufacturing Company, Alibaba Group Holding and Tencent.1
That said, it was not all smooth sailing as the factor navigated an uneven performance path in 2020. Its ride was punctuated by bumpy occasions during periods of strong reversals characterized by growth stocks retreating. From mid-May until early June, during the first half of September, and – most recently – since 9 November 2020, growth stocks lagged the market, significantly reducing the MSCI ACWI Momentum Index’s year-to-date outperformance during those intervals.
It was not all smooth sailing as the factor navigated an uneven performance path in 2020
In fact, the most evident indication of a value-growth rotation occurred after the announcement of positive phase III clinical trial results for the Pfizer-BioNTech vaccine-candidate in November. Given its heavy tilt towards large-cap growth equities and underweight exposure to smaller-cap value stocks, the MSCI ACWI Momentum Index was severely affected by the news and the subsequent rally of the value factor. Despite that, the style capped off the year as one of the top-performing factors in 2020.
Quite interestingly, we also observed large return dispersions between different momentum strategies over the period. The results are illustrated in Figure 1, where the blue bars depict the 2020 portfolio returns of various momentum signals relative to their long-term expectations.2 The chart shows that the price momentum factor had an outstanding year, exceeding not only its own long-term average, but also outperforming all the other momentum signals.

Source: Robeco, FactSet as at November 2020. Figure shows annualized average returns of portfolios constructed based on price momentum, residual momentum, analyst revisions, residual analyst revisions and news sentiment. The investment universe consists of constituents of the MSCI ACWI augmented with large and liquid constituents of the FTSE World Developed, the S&P Broad Market, and the IFC Investable Emerging Markets Index. Portfolios are constructed by investing in securities ranked in the top 20% of the respective signal and they are rebalanced monthly. Combination portfolio is based on the combined ranked where the signals are equal-weighted. Long-term average returns based on the 1986-2020 sample period (2001-2020 for news sentiment).
The picture, however, is a bit different when viewed from a longer-term perspective. Figure 2 shows the calendar-year returns of price momentum and an equal-weighted combination of momentum signals based on a historical sample. The graph reveals that a combined approach delivers higher average returns, and, importantly, also provides a much smoother ride compared to the traditional price momentum factor. The most notable performance gaps took place around significant momentum peaks (e.g. height of dot-com bubble) and momentum drawdowns (e.g. such as 2009).
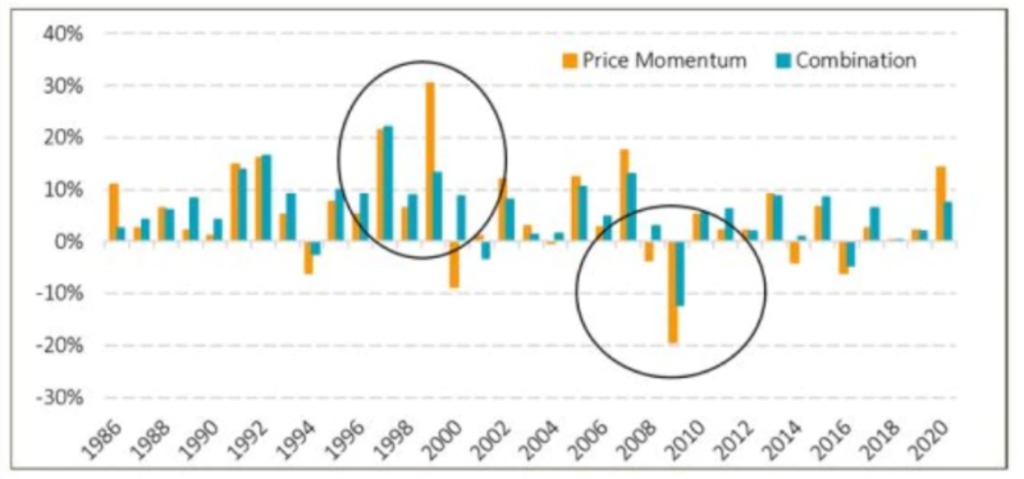
Source: Robeco, FactSet as at November 2020. Figure shows calendar-year returns of portfolios constructed based on price momentum and a combination of price momentum, residual momentum, analyst revisions, residual analyst revisions and news sentiment. The investment universe consists of constituents of the MSCI ACWI augmented with large and liquid constituents of the FTSE World Developed, the S&P Broad Market, and the IFC Investable Emerging Markets Index. Portfolios are constructed by investing in securities ranked in the top 20% of the respective signal and they are reformed monthly.
Apart from the diversification benefits derived from combining different momentum signals, the risk reduction observed stemmed from avoiding large style bets, that typically accompany traditional price momentum. These bets are, on average, unrewarded, and nearly half of the total volatility associated with traditional price momentum strategies can be attributed to them.3
Portfolio construction parameters are another source of significant return dispersion between different momentum approaches. Most notably is the allocation to mega and large-cap stocks versus smaller-cap counterparts. Several studies show that momentum is stronger in mid- to smaller-cap equities. The efficacy of the factor is reinforced by tilting it towards smaller stocks.4
Momentum can, at times, be exposed to significant style and concentration risks. Its current exposure to large-cap growth stocks that trade at lofty valuations is a good example. We believe that a well-diversified portfolio approach across momentum signals is prudent. It avoids concentrated positions and is less affected by the dynamic tilts that traditional price momentum can adopt to other factors, thereby mitigating those risks.
In our view, combining momentum with other factors has been and continues to be an effective way to improve long-term investment outcomes. Although such choices can result in headwinds at times, we believe that being cognizant of momentum’s properties, and taking them into account when designing a momentum or a multi-factor strategy, leads to better performance in the long term.
訂閱我們的電子報,獲取尖端的量化策略和見解。
1Source: MSCI. Data as of 30 November 2020.
2The long-term historical premiums for the five momentum signals are of similar magnitude. Because the signals are not perfectly correlated, the combination results in a stronger and more robust return than any single measure.
3See amongst others: Blitz, D.C., Huij, J. and Martens, M, 2011, “Residual Momentum”, Journal of Empirical Finance.
4More generally, factor premiums manifest themselves more strongly in the mid- and small-cap segments of the market. We discuss these insights in our paper: Blitz, D.C., Lansdorp, S., Roscovan, V. and Vidojevic, M., 2019 “Factor strategies need breadth”, Robeco article. Available upon request.
The contents of this document have not been reviewed by the Securities and Futures Commission ("SFC") in Hong Kong. If you are in any doubt about any of the contents of this document, you should obtain independent professional advice. This document has been distributed by Robeco Hong Kong Limited (‘Robeco’). Robeco is regulated by the SFC in Hong Kong. This document has been prepared on a confidential basis solely for the recipient and is for information purposes only. Any reproduction or distribution of this documentation, in whole or in part, or the disclosure of its contents, without the prior written consent of Robeco, is prohibited. By accepting this documentation, the recipient agrees to the foregoing This document is intended to provide the reader with information on Robeco’s specific capabilities, but does not constitute a recommendation to buy or sell certain securities or investment products. Investment decisions should only be based on the relevant prospectus and on thorough financial, fiscal and legal advice. Please refer to the relevant offering documents for details including the risk factors before making any investment decisions. The contents of this document are based upon sources of information believed to be reliable. This document is not intended for distribution to or use by any person or entity in any jurisdiction or country where such distribution or use would be contrary to local law or regulation. Investment Involves risks. Historical returns are provided for illustrative purposes only and do not necessarily reflect Robeco’s expectations for the future. The value of your investments may fluctuate. Past performance is no indication of current or future performance.