


荷宝投资组合经理

概括
- 黄金白银创下历史新高后,1月下旬迎来回调
- 持续紧张的地缘局势与供需动态为金银提供支撑
- 央行或是关键变量,市场可能再次波动
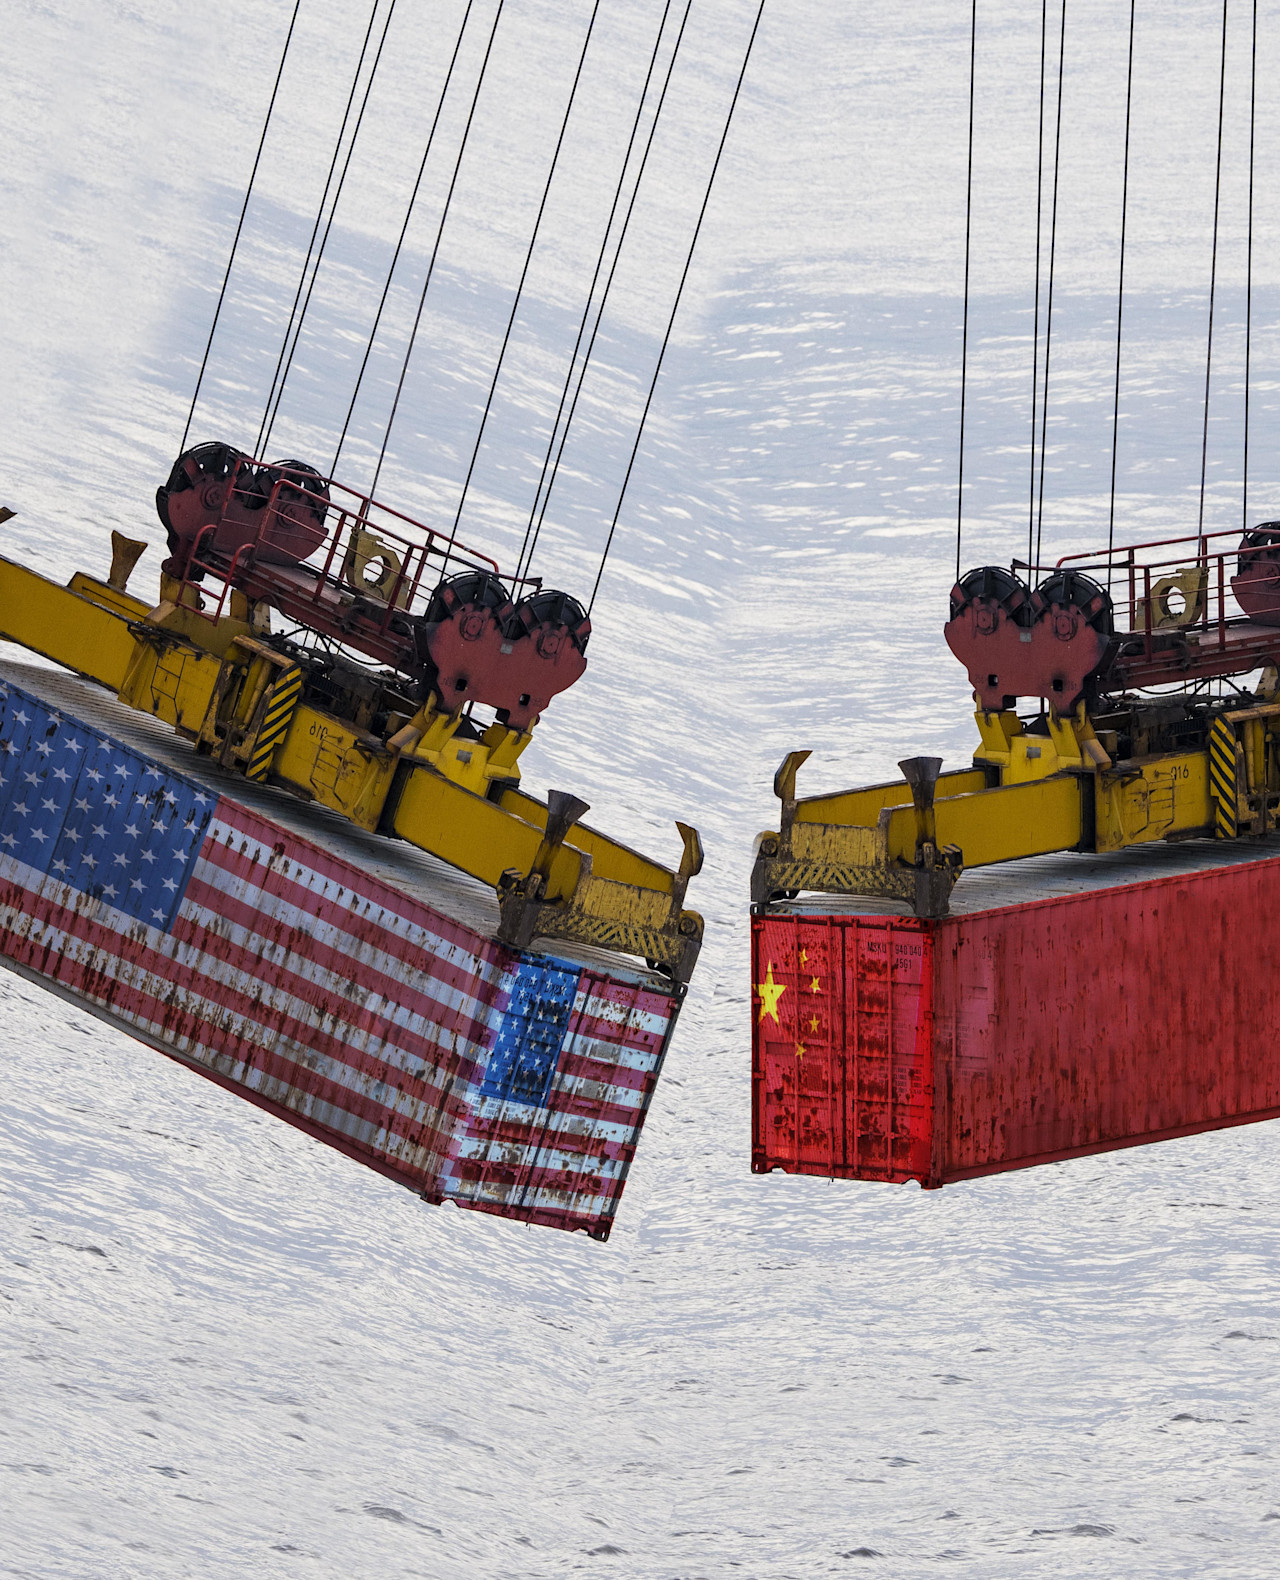
今年1月,黄金突破每盎司5000美元的历史大关,一度触及5600美元的高点,随后在2月2日暴跌逾15%至4500美元。作为数百年来的避险首选,由于格陵兰岛和伊朗局势出现新的冲突担忧,加之持续的中美贸易紧张局势,黄金价格在过去12个月里几乎翻了一番。
白银涨势更为惊人,一度创下每盎司121美元的历史纪录,随后回调逾40%至72美元。过去一年银价涨幅超过一倍,部分原因在于清洁能源和人工智能等工业应用领域的需求远超矿产供应。白银曾是各国铸币的基础,其自身作为一种货币形式至今仍保有声望。
在投资组合中,两者都被归类为大宗商品。但它们真的值得如此追捧吗?荷宝多资产投资专家Arnout van Rijn表示:"在金银经历惊人上涨、随后又迎来引人注目的回调之后,现在正是复盘其价值的恰当时机。我们可以先后从五年期和一年期的视角来审视。"
"在荷宝最新《五年收益展望》(2026-2030年)中,我们将大宗商品的回报预期从4.75%上调至5.25%(以欧元计)。我们对该资产类别将实现高于平均水平的回报率给出了两个根本原因。"
"首先,电气化进程、基础设施建设以及国防支出,带动了金属需求的增长。其次,通胀预期上升叠加美国债务高企,导致美国国债等传统代替性避险资产的吸引力下降。"
"我们还指出大宗商品已不便宜——当然这只是基于其交易价格高于五年均线的事实(石油是个明显例外)。此后,我们增加了黄金和工业金属的配置。"
如下图显示,尽管2025年全球股市大幅上涨,但黄金表现仍远超股票。回顾至2005年的20年数据,情况亦是如此。
图1: 2005年以来黄金与股票、债券表现对比
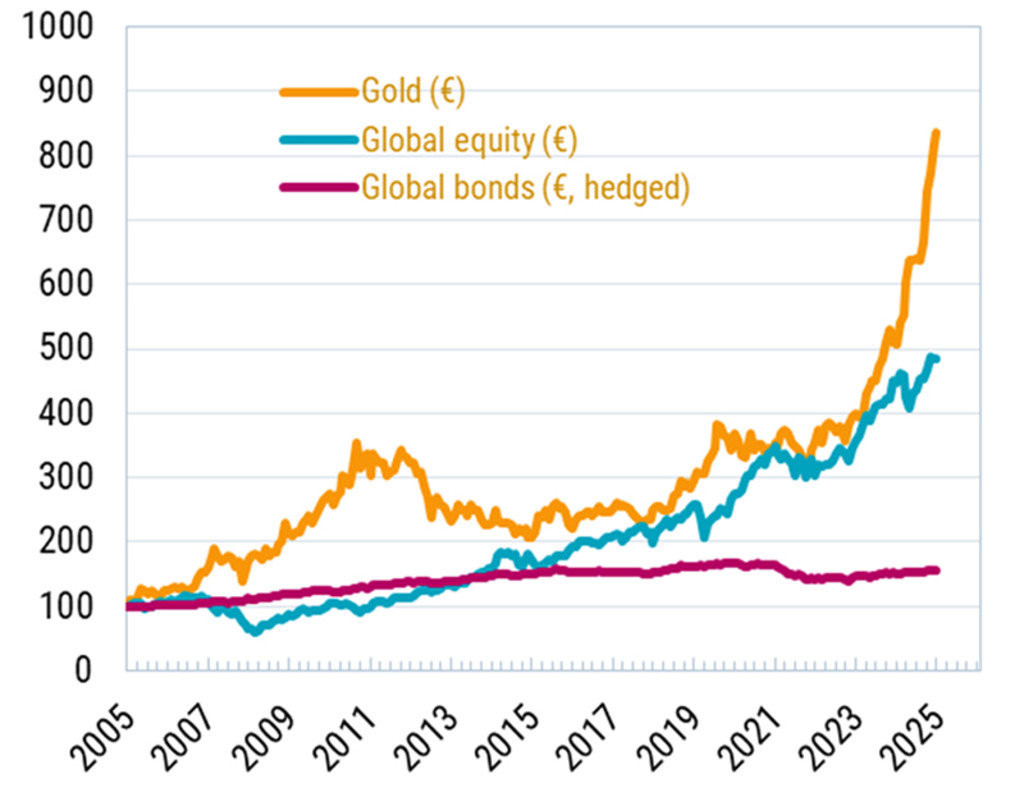
过往表现不代表未来回报。投资价值可能波动。
资料来源:彭博,2025年12月
将时间拉得更长来看,过去半个世纪里黄金是表现第二佳的资产类别,仅次于股票。白银位列第三,但波动性明显更高。过去50年,大宗商品整体实现了5.7%的欧元回报率,而石油仅上涨3.2%,如下表所示。
Van Rijn表示:"黄金因其安全性脱颖而出,波动率仅17.4%,而白银和石油的波动率均超过30%。此外,闪耀金属与股票和债券的相关性较低。铜的历史数据稍短,但回顾近40年,其回报率略高于5%,但同样伴随着25%的较高波动率。"
"对长期投资者而言,结论很明确:在多资产组合中,将部分资金配置到大宗商品这类不生息资产上是合理的。金属越闪耀,回报越可观。我们买入黄金是为了分散风险,同时获取长期稳健回报,且波动有限。"
表2:1976年以来各类资产回报表现

过往表现不代表未来回报。投资价值可能波动。
资料来源:荷宝,2026年1月
*以上章节中所提及回报率、波动率、股票相关性、夏普比率均为年化数据。
供应成本动态:估值支撑
但对于这两种供应有限的金属,其供应成本动态又如何?根据世界黄金协会数据,人类历史上开采出的黄金总量仅约22万吨,而地下剩余储量仅约6万吨。1
Van Rijn表示:"只有在价格偏低时,边际生产成本才能为估值提供底部支撑——价格再低就会抑制供给,促使市场重归平衡。显然,黄金和白银的情况并非如此,其边际
生产成本分别约为每盎司1700美元(现货5000美元)和每盎司20美元(现货90美元)。"
"铜的支撑更强,其边际成本约每盎司5美元,而市场价格为每盎司6美元。从这个角度看,石油也获得更好支撑。"
回调的触发因素
那么,潜在风险在哪里?特朗普提名的美联储新主席人选是位经验丰富的央行官员、著名的鹰派人物——这消除了全球最大金融体系可能出现更多不稳定的担忧——从而触发了避险金属价格下跌。
Van Rijn表示:"展望2026年,以一年期视角来看,宏观环境支持黄金作为对冲过度债务和货币超发的工具。但除非国债市场和美元双双大幅下跌,否则我们并不相信所谓的货币贬值交易。"
“对美联储独立性的担忧已经消退,部分相信现有金融体系即将终结的边缘买家因此而离场。而且,鉴于美国当前的强势姿态,很难想象会有欧洲央行转变立场,将其黄金储备转换成美国国债。”
"但民粹主义政权下不可预测的政策可能导致一些国家将央行资产负债表上的黄金浮盈变现,从而打破当前有利的供需平衡。"
波动或将持续
Van Rijn表示,另一种波动可能即将到来,其驱动因素是一种泡沫心态。这种心态也曾推高人工智能相关股票,以及此前的比特币"数字黄金"狂热。得益于ETF投资方式的便捷性,散户投资者也是金价上涨的推手之一。
Van Rijn表示:"2025年,黄金价格受中美散户推动呈指数级上涨,1月下旬那种回调不可避免。随着更多意志不坚定的持有者被闪耀金属的诱人故事吸引,2026年出现更多抛售的可能性不小。在当前价格水平处于高位且市场普遍看涨的情况下,获利了结是合理选择。"
脚注
免责声明:
本文由荷宝私募基金管理(上海)有限公司(“荷宝上海”)编制, 本文内容仅供参考, 并不构成荷宝上海对任何人的购买或出售任何产品的建议、专业意见、要约、招揽或邀请。本文不应被视为对购买或出售任何投资产品的推荐或采用任何投资策略的建议。本文中的任何内容不得被视为有关法律、税务或投资方面的咨询, 也不表示任何投资或策略适合您的个人情况, 或以其他方式构成对您个人的推荐。本文中所包含的信息和/或分析系根据荷宝上海所认为的可信渠道而获得的信息准备而成。荷宝上海不就其准确性、正确性、实用性或完整性作出任何陈述, 也不对因使用本文中的信息和/或分析而造成的损失承担任何责任。荷宝上海或其他任何关联机构及其董事、高级管理人员、员工均不对任何人因其依据本文所含信息而造成的任何直接或间接的损失或损害或任何其他后果承担责任或义务。本文包含一些有关于未来业务、目标、管理纪律或其他方面的前瞻性陈述与预测, 这些陈述含有假设、风险和不确定性, 且是建立在截止到本文编写之日已有的信息之上。基于此, 我们不能保证这些前瞻性情况都会发生, 实际情况可能会与本文中的陈述具有一定的差别。我们不能保证本文中的统计信息在任何特定条件下都是准确、适当和完整的, 亦不能保证这些统计信息以及据以得出这些信息的假设能够反映荷宝上海可能遇到的市场条件或未来表现。本文中的信息是基于当前的市场情况, 这很有可能因随后的市场事件或其他原因而发生变化, 本文内容可能因此未反映最新情况, 荷宝上海不负责更新本文, 或对本文中不准确或遗漏之信息进行纠正。