Head of Fixed Income Client Portfolio Management


• インサイト
There’s no quant crisis in credits
Quant strategies have performed well in credits. This is in contrast to quant equities, where strategies exposed to the value factor have struggled.
執筆者


クオンツ債券共同責任者、リード・ポートフォリオ・マネジャー
主なキーワード
まとめ
- Quant strategies have performed well in credits, unlike in equities
- Value factor in credits unaffected by outperformance of big tech
- Multi-factor portfolios in credit and equity have a low correlation
Quant equity strategies, hedge funds and alternative risk premia strategies have struggled in recent years to keep up with markets, with strategies exposed to the value factor being hit particularly hard. Not surprisingly, then, terms such as ‘quant quake’ and ‘quant crisis’ were coined to label this period of underperformance in quant strategies. The positive performance of quant credit strategies during this period seems to have received less attention, though. Remarkably, the value factor was the main driver of the outperformance in the credit market. In this article we explain in more detail why value did not struggle in credits – and, consequently, why there is no quant crisis in credits.
Most quant or factor-based equity strategies have exposure to the value factor. Value investing is the best-known and oldest investment style, and the value premium has been documented in numerous academic studies. Attractively valued stocks are typically those of mature companies in traditional business sectors that are less popular among investors. Although value stocks have historically outperformed growth stocks, the experience in recent years has been completely different: the incredible returns generated by a handful of very large growth companies in the technology sector have dominated the market’s average return and boosted stock market indices to all-time highs.
To illustrate, the cumulative total return of the FAANG stocks1 over the last five years was a staggering 280%, compared to 78% for the broad MSCI World Index, which would have been 11 percentage points lower without the FAANG stocks. From a valuation perspective, big tech stocks were unattractive as they were trading at expensive multiples such as the traditional price-to-book ratio. They were therefore not selected in value portfolios. Portfolios without big tech stocks clearly lagged their benchmarks, and so did most quant equity strategies that employed the value factor in their investment process. Outperforming equity factors like profitability and momentum failed to offset the losses of the value factor2.
最新のインサイトを受け取る
投資に関する最新情報や専門家の分析を盛り込んだニュースレター(英文)を定期的にお届けします。
No big tech dominance in credits
The dominance of big tech firms in the equity market does not exist in credits. While the high returns of big tech stocks may have been justified by the theoretically unlimited upside potential in future revenues for equity investors, bond returns were much lower because bond holders are left with just fixed coupons and repayment of the bond’s notional value. We illustrate this in Figure 1, in which we compare the return of an investment in an Apple stock and an Apple bond over the 2016-2020 period. The cumulative return of the Apple stock was 453%, compared with 28% for the bond.
Figure 1 | Apple stock and bond return
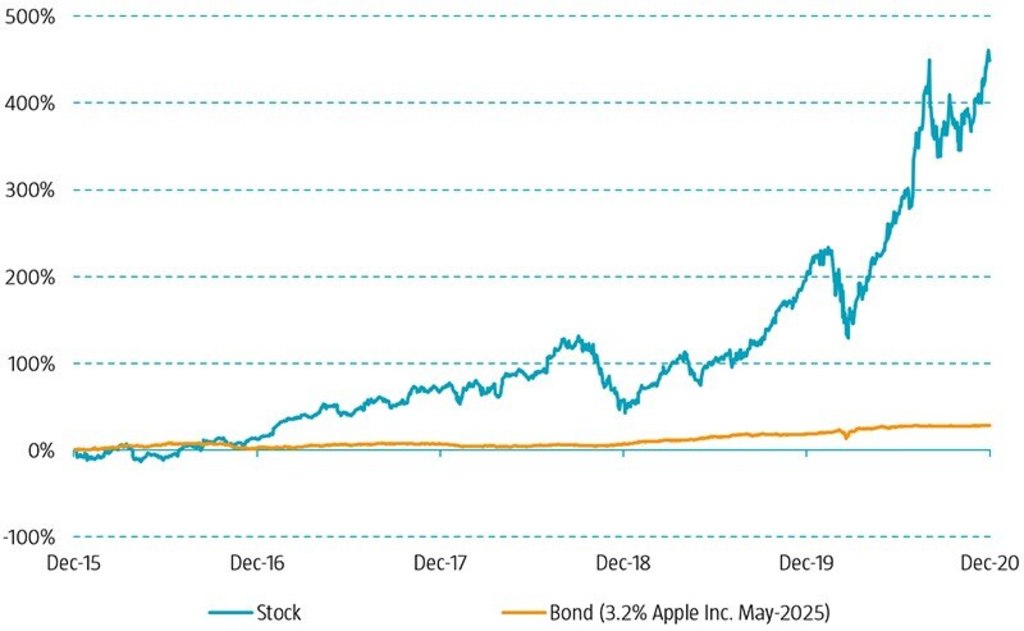
Source: Bloomberg. Apple stock return in USD based on closing prices adjusted for dividends and stock splits. Apple bond return is the total return in USD including coupons.
Due to the extreme rally of big tech stocks, the weight of the technology sector in the MSCI World index also grew rapidly, from 14% at the end of 2015 to 22% at the end of 2020, amplifying their dominance in equity index returns. In short, tech stocks were already big and expensive in 2015, but due to their strong performance they only got bigger and more expensive over the past few years.
By contrast, the returns of big tech firms had much less of an impact on credit index returns. This is not only because the bond returns were much lower than the equity returns, but also because the weight of these firms in the credit index was much smaller. Big tech firms did not issue a lot of bonds as they could more cheaply finance their acquisitions with stocks or cash. To illustrate, the total weight of Apple, Microsoft, Amazon, Facebook, Alphabet and Tesla in the credit market is only 1.5%, while these six companies represent almost 15% of the global equity market.
Value in credits
We see that value in equities struggled, mainly due to missing out on the staggering returns of big tech companies, and that big tech did not dominate in terms of returns and market weight in credits. So how did value perform in credits?
Remarkably, value was the best-performing factor in the credit market over the past five years compared to other well-known factors such as low-risk, quality, momentum and size. How can the strong performance of value in credits be explained? In short, value prefers bonds that are attractively priced and thus have above-average credit spreads compared to other bonds with the same risk profile. Such bonds generally perform strongest when credit markets compress and deliver positive credit returns, while the low-risk factor does better when credit returns are negative, as it prefers bonds and issuers that are safer than average. In recent years, credit markets generally posted positive credit returns, supported by the ongoing search for yield and central bank corporate bond buying programs. In this environment, value performed strongly.
In terms of the value factor’s preferences in the credit market, we find that it actually had a modest preference for the technology sector on average over the last five years. So, bonds from tech firms on average carried somewhat attractive risk premiums given their credit risk and given the credit spreads of similarly risky bonds. This contrasts sharply with the unattractive valuations of tech firms in the equity market and the underweight in many quant equity strategies. Robeco’s Multi-Factor Credits strategy did have overweigh
t positions in tech companies. Next to the somewhat attractive valuations, the overweights were mainly driven by the low-risk/quality and momentum factors that appreciated their characteristics of – on average – solid balance sheets, attractive profitability and strong equity market momentum. The divergent relative performance of multi-factor portfolios in equities and credits is not a surprise. Previous research shows that the two only have a 17% correlation.
Footnotes
1 The weighted average total return in USD of a group of big tech firms: Facebook, Apple, Amazon, Netflix and Alphabet (Google) over the period January 2016 to December 2020.
2 For more insights we refer to the article “The quant equity crisis of 2018-2020: Cornered by big growth” by David Blitz, published in February 2021.
重要事項
当資料は情報提供を目的として、ロベコ・ジャパン株式会社(以下「当社」)が独自に作成、または当社のグループ会社(Robeco Institutional Asset Management B.V.およびその関連会社を含む)から提供された資料を当社が編集・翻訳したものです。資料中の個別の金融商品の売買の勧誘や推奨等を目的とするものではありません。記載された情報は十分信頼できるものであると考えておりますが、その正確性、完全性を保証するものではありません。意見や見通しはあくまで作成日における弊社の判断に基づくものであり、今後予告なしに変更されることがあります。運用状況、市場動向、意見等は、過去の一時点あるいは過去の一定期間についてのものであり、過去の実績は将来の運用成果を保証または示唆するものではありません。また、記載された投資方針・戦略等は全ての投資家の皆様に適合するとは限りません。当資料は法律、税務、会計面での助言の提供を意図するものではありません。 ご契約に際しては、必要に応じ専門家にご相談の上、最終的なご判断はお客様ご自身でなさるようお願い致します。 運用を行う資産の評価額は、組入有価証券等の価格、金融市場の相場や金利等の変動、及び組入有価証券の発行体の財務状況による信用力等の影響を受けて変動します。また、外貨建資産に投資する場合は為替変動の影響も受けます。運用によって生じた損益は、全て投資家の皆様に帰属します。したがって投資元本や一定の運用成果が保証されているものではなく、投資元本を上回る損失を被ることがあります。弊社が行う金融商品取引業に係る手数料または報酬は、締結される契約の種類や契約資産額により異なるため、当資料において記載せず別途ご提示させて頂く場合があります。具体的な手数料または報酬の金額・計算方法につきましては弊社担当者へお問合せください。 当資料及び記載されている情報、商品に関する権利は弊社に帰属します。したがって、弊社の書面による同意なくしてその全部もしくは一部を複製またはその他の方法で配布することはご遠慮ください。 商号等: ロベコ・ジャパン株式会社 金融商品取引業者 関東財務局長(金商)第2780号 加入協会: 一般社団法人 資産運用業協会