PhD, Head of Robeco Indices


• 市場觀點
Indices insights: Does climate beta pick up on climate risk?
Our climate beta measure quantifies how sensitive a stock is to the transition to a low-carbon economy. We demonstrate how this metric can clearly discern between companies that are vulnerable to transition risks and those that are likely to benefit from a shift towards net-zero emissions.
作者




Climate Data Scientist



Head of SI Thought Leadership and Climate & Biodiversity Strategist

PhD, Portfolio Manager Robeco Indices
概要
- Climate beta measures how sensitive a stock is to climate risk
- The metric distinguishes between climate leaders and laggards
- It captures different dimensions of climate risk versus carbon footprints
In the previous ‘Indices insights’ articles,1 we first discussed how generic carbon emissions data is less effective in differentiating between climate leaders and laggards. We then focused on a long-short – polluting-minus-clean (PMC) – portfolio that tracks the difference in returns between polluting and clean companies. Moreover, we illustrated how the PMC portfolio underperforms in months with heightened climate concerns, and vice versa.
In this article, we expand on our findings by introducing our climate beta measure which indicates how sensitive individual stocks are to the PMC portfolio.2 More specifically, firms with a high climate beta tend to do well when the PMC portfolio has a positive return, while the opposite is typically true for companies with a low climate beta.
As a result, we expect stocks with high climate betas to be negatively affected by stricter climate policies, the transition to a low-carbon economy and innovations in green technologies. On the other hand, we expect stocks with low climate betas to benefit from a shift towards net-zero emissions. In general, we contend that climate beta picks up on a different dimension of climate risk compared to carbon emissions or carbon footprint data.
For instance, climate beta has a forward-looking element as it incorporates market expectations, whereas carbon emissions are based on lagged or current datapoints at best. Since climate beta is estimated using returns, it can pick up on important factors such as (changes to) a firm’s business model, its access to green technology and innovation, competition and its financial health.
While carbon emissions data can be used to filter out heavy-polluting companies, it is not useful for identifying stocks that could benefit from the transition to a low-carbon economy or those that have announced plans to reduce their emissions. Climate beta, on the other hand, can distinguish between firms that are vulnerable to the transition and those that stand to benefit from it.
Using a hypothetical example, we can illustrate this by comparing a company that produces solar panels with one that manufactures vehicles with internal combustion engines. The production processes for both firms are responsible for relatively high levels of carbon emissions, and for the purposes of our argument, we assume that the carbon footprints are the same for both operations.
If a carbon tax is implemented, it will likely lead to increased fossil fuel prices and decreased demand for internal combustion engine vehicles, resulting in a negative return for the car manufacturer. On the flipside, the carbon tax will likely instigate higher energy prices, which in turn will probably drive a rise in solar power demand, thus benefiting the solar panel producer and its share price.
Similarly, we would anticipate a negative return from the PMC portfolio if a carbon tax is implemented as it typically underperforms in environments with heightened climate concerns. Based on these dynamics, we would expect the car manufacturer to have a relatively high climate beta and the solar panel producer to have a relatively low climate beta.

訂閱 – 指數洞察
時刻把握荷寶最新可持續性、因子及市場觀點文章。
Climate beta can be used to assess transition risk
To assess whether climate beta captures a different dimension of climate risk versus carbon footprint data and whether it picks up on transition risk, we analyzed the holdings of renewable energy and oil ETFs. Specifically, we calculated the estimated climate betas and weighted-average carbon footprints of ‘clean’ energy and ‘pollutive’ oil portfolios.
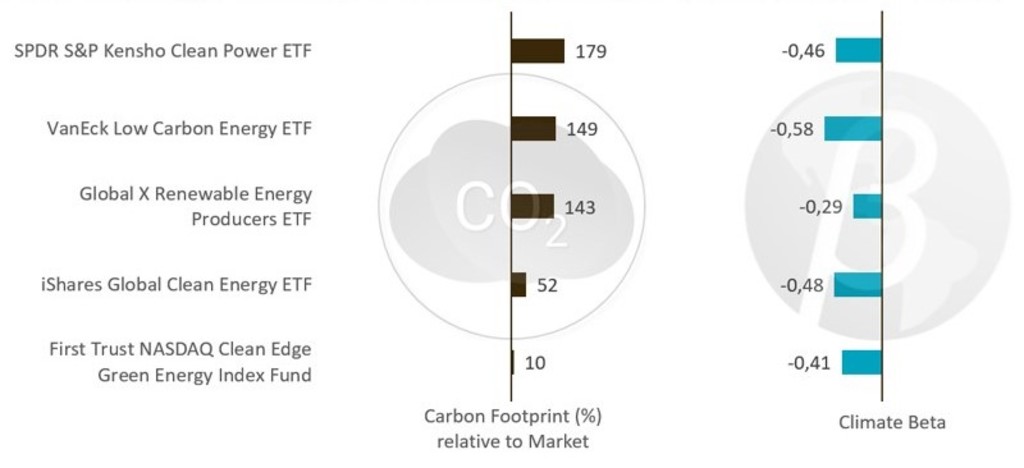
Figure 1 depicts the carbon footprints (brown bars) relative to the broad market index and the climate betas (blue bars) of some of the largest renewable energy-focused ETFs.3 Interestingly, we see that all the renewable energy-themed portfolios have higher carbon footprints than the market, despite their focus on clean energy.
By contrast, their climate betas are negative; implying that they would tend to deliver positive returns when the PMC portfolio generates negative performance, and vice versa. In other words, these ETFs exhibit relatively low climate transition risk.4 Hence, a high carbon footprint does not necessarily equal high transition risk.
Figure 1 | Renewable-energy ETFs have high carbon footprints, but negative climate betas (climate leaders)
Source: Robeco, TruCost, FactSet, Morningstar. The analysis is conducted using data as of 31 July 2022.
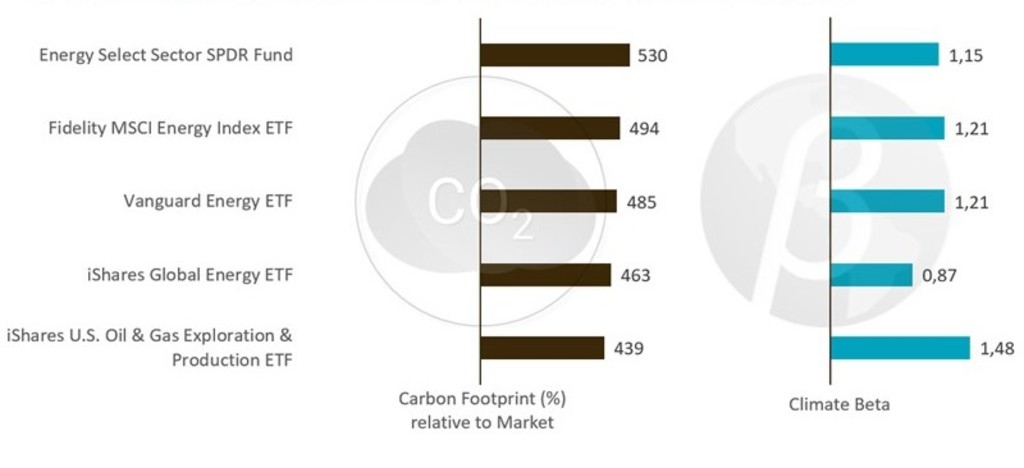
Similarly, we observed that all the oil ETFs have significantly higher carbon footprints than the market as shown in Figure 2. However, their climate betas are positive without any exceptions. Therefore, we would expect their returns to move in the same direction as those of the PMC portfolio, meaning that they exhibit high transition risk.
Figure 2 | Oil ETFs have high carbon footprints and positive climate betas (climate laggards)
Source: Robeco, TruCost, FactSet, Morningstar. The analysis is conducted using data as of 31 July 2022.
This outcome demonstrates that climate beta captures different information on climate risk compared to carbon footprint data, i.e. transition risk. Thus, it is better suited to distinguish between climate leaders and laggards. Put differently, a generic low-carbon investment approach would shy away from investing in renewable energy firms with high carbon footprints, even though these companies are deemed important for the transition to a low-carbon economy.
Data and methodology
Our selection of renewable energy ETFs is based on a combination of ‘renewable energy’ ETFs from etf.com and ‘clean energy’ ETFs from etfdb.com. These consist of global or US-listed stocks that are linked to firms involved in clean energy production (such as biofuels, solar, wind or other renewable sources) or in related activities (such as batteries and smart grids or firms that finance green projects). Our final sample of renewable energy portfolios comprises the five largest ETFs based on assets under management for which we have data coverage for at least 60% of their holdings.
In terms of oil ETFs, our selection is based on a combination of ‘oil’ ETFs from etf.com and ‘oil & gas exploration & production’ ETFs from etfdb.com. These offer exposure to the exploration and production sub-sectors and include many of the largest oil producers. Similar to our approach with the renewable energy ETFs, our final sample of oil ETFs comprises the five largest ETFs based on assets under management for which we have data coverage for at least 60% of the ETF holdings.
The data for the ETF holdings is sourced from Morningstar as at 31 July 2022. The holdings for the broad market index are based on the MSCI World Index and are sourced from FactSet. We calculate the carbon footprints and climate betas for each of the ten ETFs and market index. We define the portfolio carbon footprint as the weighted-average carbon footprint measured by TruCost Scope 1 and 2 emissions divided by enterprise value including cash (EVIC) relative to the market index. For climate beta, we use 36-month historical betas by regressing stock returns on the Robeco Developed Climate Risk L/S Factor Index.5
Conclusion
Based on our analysis, we conclude that the climate beta measure provides additional insights on climate risk compared to carbon footprint data. For instance, we demonstrate that the carbon footprints of renewable energy and oil ETFs are both relatively high. However, their climate betas clearly differentiate between the portfolios that are vulnerable to transition risk and those that are likely to benefit from a shift towards net-zero emissions.
The Indices insights series provides new insights focused on index investing, particularly on the topics of sustainable investing, factor investing and/or thematic investing. The articles are written by the Sustainable Index Solutions team and often in close cooperation with a Robeco specialist in the field. The team has vast experience in research and portfolio management and has been designing sustainable, factor and thematic indices since 2015 for a large variety of clients: sovereign wealth funds, pension funds, insurers, global investment consultants, asset managers and private banks. The team can also tailor sustainable indices to cater to client-specific needs.
Footnotes
1 Huij, J., Lansdorp, S., Peppelenbos, L., and Markwat, T., June 2022, “Can carbon emissions data identify leaders and laggards”, Robeco article; and Huij, J., Lansdorp, S., Peppelenbos, L., and Markwat, T., August 2022, “Do investors act on shifts in climate change”, Robeco article.
2 Climate beta is in spirit similar to carbon beta which is introduced in the paper by Huij, J., Laurs, D., Stork, P. A., and Zwinkels, R. C. J., November 2021, “Carbon beta: A market-based measure of climate risk”, SSRN working paper. In this article, carbon beta is estimated based on a portfolio that is long a basket of stocks consisting of high carbon emitters and short a basket of stocks consisting of low carbon emitters. Climate beta, on the other hand, is estimated based on a portfolio that is long a basket of stocks with negative climate SDG scores and short a basket of stocks with positive climate SDG stocks.
3 Thus, a carbon footprint of 100% means the ETF has a carbon footprint that is twice as high as that of the broad market index. Please note that the climate beta of the market index is equal to zero.
4 Please note we might be oversimplifying the concept. The transition is not per se linear and markets can also (temporarily) work against renewable energy.
5 See: www.spglobal.com/spdji/en/custom-index-calculations/robeco-indices-bv/all/#overview
指數洞察
重要資料
本網站僅供《證券及期貨條例》(香港法例第571章)及其附屬法例所界定之專業投資者瀏覽及使用。 投資涉及風險。過往表現並不代表未來表現。本網站所載資料僅供參考之用,並不構成任何投資建議,亦非作出買賣任何證券或採納任何投資策略之要約或招攬。投資者不應僅憑本網站提供之資料作出投資決定,在作出任何投資決定前,應徵詢獨立意見(包括有關稅務影響之意見)。投資者應確保完全理解投資產品的相關風險,亦應考量自身投資目標及風險承受水平。投資乃閣下之個人決定。除非銷售投資產品的中介人已向閣下告知該投資產品適合閣下,並已解釋其符合閣下投資目標之原因,否則閣下不應投資。請參閱相關發售文件或其他法律文件,以獲取包括風險因素在內的進一步詳情。 本網站由荷寶投資管理香港有限公司發布,該公司受香港證券及期貨事務監察委員會(「證監會」)規管(中央編號:APU851)。本網站未經證監會審閱。 無法保證任何投資產品可實現其投資目標。概不就任何投資產品之表現或投資回報作任何聲明或承諾。投資的價值或會波動。本網站所載過往表現、推算或預測,均不應視作未來表現之保證或指標,且概不提供任何明示或暗示之保證。本網站內容建基於相信為可靠之來源,惟因應資料傳遞技術特性及須採用多項數據來源(包括第三方內容),故概不保證其準確性。所述觀點僅乃截至上述日期,或會隨市況變化而改變,可予更改而毋須另行通知。該等意見可能有別於其他荷寶投資專業人士之意見。因使用本材料或當中所載任何評論、意見或估算而引致之直接、間接或相應損失,荷寶概不承擔法律責任。荷寶並無責任更新本網站或任何網站內容。未經荷寶事先書面許可,不得複製、分發或刊發本網站任何材料。 除非另有說明,資料來源:荷寶。