PhD, Head of Robeco Indices


• 市場觀點
Indices insights: To what extent can carbon emissions data identify climate leaders and laggards?
Carbon emissions do not tell the full story on companies’ climate change awareness. That said, investors routinely rely on carbon metrics to track progress on their decarbonization objectives. In this Indices insights article, we analyze to what degree climate leaders and laggards can be identified using carbon footprint measures.
作者




PhD, Portfolio Manager Robeco Indices



Head of SI Thought Leadership and Climate & Biodiversity Strategist

Climate Data Scientist
概要
- Carbon footprint measure quantifies past or current greenhouse gas emissions
- The metric is less useful for identifying climate leaders and laggards
- Additional climate data that captures other dimensions is needed to discern between the two
As climate change becomes a key issue for most investors, the focus on carbon footprint reduction in investment portfolios has increased and net-zero commitments have moved into the mainstream.1 In response, industry players have developed several low-carbon investment vehicles and Paris-aligned benchmarks. What these have in common is the exclusion of companies with high carbon emissions or intensities.
Undeniably, generic carbon emissions data is useful for mapping out portfolio-level or entity-level decarbonization pathways. However, this begs the question of whether the simple approach of excluding or divesting from high carbon emitters is the most effective mechanism to transition to a low-carbon economy. In other words, it is worth examining whether the information gleaned from carbon emissions data suffices for identifying climate leaders and laggards.
Recent research shows that green innovation is primarily driven by the energy and materials sectors, two of the most carbon intensive industries.2 Within these segments, however, the more innovative firms do not necessarily have the lowest carbon emissions or intensities. As such, carbon emissions data alone is unlikely to be an effective guide to identifying firms involved with green innovation, or to distinguish between climate leaders and laggards, as it only considers past or current emissions.
An alternative approach to pinpointing climate leaders and laggards is to assess how firms impact specific climate-related SDGs. For example, Robeco’s proprietary SDG framework can be used to evaluate the contributions companies make to these SDGs, taking into account what they produce and how they operate. The resulting SDG scores then indicate if the firms positively or negatively impact the relevant climate-related SDGs, and to what extent.
Carbon emissions data is not useful in distinguishing between climate leaders and laggards
To evaluate this notion, we analyzed the relationship between climate leaders/laggards and their respective carbon footprints. Specifically, we looked at the intersection of companies that have low carbon footprints and either low or high climate-related SDG scores, and the intersection of firms that have high carbon footprints and either low or high climate-related SDG scores.
If carbon emissions data is a sufficient measure to differentiate between climate leaders and laggards, we would expect low carbon footprint companies to highly overlap with high climate-related SDG scores, and high carbon footprint companies to highly overlap with low climate-related SDG scores.
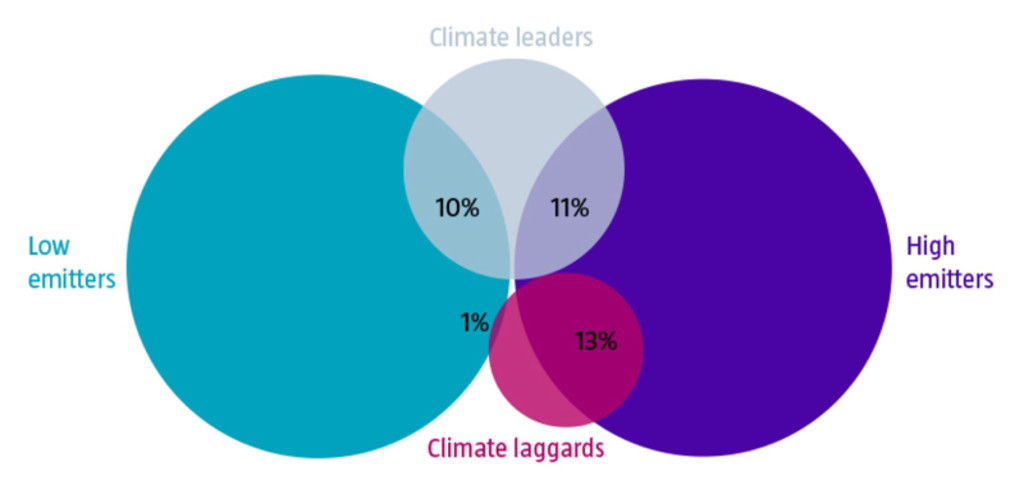
Figure 1 | A significant number of climate leaders/laggards are not identified with the use of carbon footprint data
Source: Robeco, TruCost. The analysis is conducted using data as of end of December 2021.
As shown in Figure 1, we found that carbon emissions data is too crude to effectively differentiate between climate leaders and laggards on an issuer level. While 13% of high emitters are considered climate laggards, there is also a considerable share of 11% of high emitters which are viewed as climate leaders. Put differently, a low-carbon approach that relies solely on carbon footprint data for exclusions or divestments is also likely to ignore high carbon-emitting firms which, in fact, contribute positively to the climate-related SDGs and are deemed essential for the transition to a low-carbon economy.
Focusing on the group of low emitters based on carbon emissions, a portion of 1% are seen as climate laggards as these companies contribute negatively to the climate-related SDGs. But more strikingly, only 10% of low emitters are classified as climate leaders, less than the share of climate leaders within the high emitters cluster. This suggests that carbon emissions data is ineffective in identifying firms involved with green innovation. Therefore, complementary stock-level climate data is required to achieve this goal.

訂閱 – 指數洞察
時刻把握荷寶最新可持續性、因子及市場觀點文章。
Data and methodology
For our analysis, we based our investment universe on the constituents of the MSCI World Investable Market Index (MSCI World IMI) as at the end of December 2021. We used carbon footprint data sourced from TruCost, defined as Scope 1 and 2 divided by enterprise value including cash (EVIC).
We used SDG scores based on Robeco’s proprietary SDG framework. We focused only on certain climate-related SDGs, specifically SDG 7 (affordable and clean Energy), SDG 11 (sustainable cities and communities) and SDG 13 (climate action). To calculate the final climate-related SDG score, we took the lowest of the three scores if one of them was negative, and the highest of the three scores if they were all positive. Combined, this analysis covered 73% of the stocks and 85% of the total market capitalization of the MSCI World IMI.
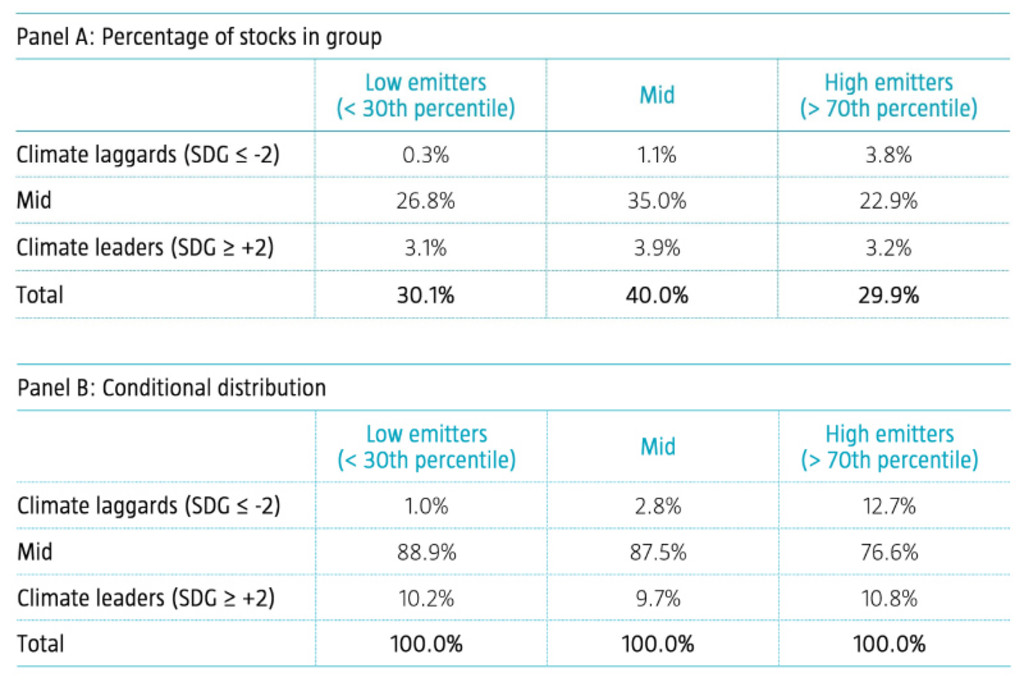
We then sorted stocks into 3x3 mutually exclusive groups based on their carbon footprints and climate-related SDG scores. For carbon footprints, we grouped stocks using the 30th and 70th percentiles. Companies that had a climate-related SDG score of -3 or -2 were classified as climate laggards, and those with a climate-related SDG score of +2 or +3 were classified as climate leaders. Panel A in Table 1 depicts the percentage of stocks that belonged to each of the nine groups. Panel B shows the conditional distribution on the carbon footprints.
Table 1 | Distribution of stocks sorted on carbon footprints and climate-related SDG scores
Source: Robeco, TruCost. The analysis is conducted using data as of end of December 2021.
Based on the conditional distribution, we constructed proportional Venn diagrams. These display the overlap between high emitters and climate laggards, high emitters and climate leaders, low emitters and climate laggards as well as low emitters and climate leaders. The total area of the circles are proportional to the number of stocks that belong to a group.
Conclusion
While carbon footprint is a useful metric for mapping out portfolio-level or entity-level decarbonization pathways, we find that it is less effective in differentiating between climate leaders and laggards. Indeed, a significant number of climate leaders and climate laggards are not identified using this measure. For this purpose, we suggest complementing carbon footprint measures with additional stock-level climate data that captures dimensions in addition to emissions.
Footnotes
1 See: Robeco, March, 2022, “2022 global climate survey”, Robeco publication.
2 See: Cohen, L., Gurun, U.G., and Nguyen, Q., January 2021, “The ESG-innovation disconnect: evidence from green patenting”, SSRN working paper, and Huij, J., Laurs, D., Stork, P. A., and Zwinkels, R. C. J., November 2021, “Carbon Beta: A market-based measure of climate risk”, SSRN working paper.
Background to sustainability metrics
In defining sustainability, investors have a multitude of dimensions and metrics they could consider. For example:
Values-based exclusions
ESG integration
Impact investing
ESG scores typically put more focus on the operations of a business, whereas SDG scores also incorporate the impact that the business’ products and/or services have on society.
We see client sustainability objectives increasingly moving towards avoiding controversial businesses (values-based exclusions) and including those that provide sustainable solutions (impact investing). In the first few articles of our Indices Insights series, we will empirically show how the different sustainability metrics (negative screening/exclusions, ESG, SDG) relate to these increasingly impact-oriented client sustainability objectives.
The Indices insights series provides new insights focused on index investing, particularly on the topics of sustainable investing, factor investing and/or thematic investing. The articles are written by the Sustainable Index Solutions team and often in close cooperation with a Robeco specialist in the field. The team has vast experience in research and portfolio management and has been designing sustainable, factor and thematic indices since 2015 for a large variety of clients: sovereign wealth funds, pension funds, insurers, global investment consultants, asset managers and private banks. The team can also tailor sustainable indices to cater to client-specific needs.
指數洞察
重要資料
本網站僅供《證券及期貨條例》(香港法例第571章)及其附屬法例所界定之專業投資者瀏覽及使用。 投資涉及風險。過往表現並不代表未來表現。本網站所載資料僅供參考之用,並不構成任何投資建議,亦非作出買賣任何證券或採納任何投資策略之要約或招攬。投資者不應僅憑本網站提供之資料作出投資決定,在作出任何投資決定前,應徵詢獨立意見(包括有關稅務影響之意見)。投資者應確保完全理解投資產品的相關風險,亦應考量自身投資目標及風險承受水平。投資乃閣下之個人決定。除非銷售投資產品的中介人已向閣下告知該投資產品適合閣下,並已解釋其符合閣下投資目標之原因,否則閣下不應投資。請參閱相關發售文件或其他法律文件,以獲取包括風險因素在內的進一步詳情。 本網站由荷寶投資管理香港有限公司發布,該公司受香港證券及期貨事務監察委員會(「證監會」)規管(中央編號:APU851)。本網站未經證監會審閱。 無法保證任何投資產品可實現其投資目標。概不就任何投資產品之表現或投資回報作任何聲明或承諾。投資的價值或會波動。本網站所載過往表現、推算或預測,均不應視作未來表現之保證或指標,且概不提供任何明示或暗示之保證。本網站內容建基於相信為可靠之來源,惟因應資料傳遞技術特性及須採用多項數據來源(包括第三方內容),故概不保證其準確性。所述觀點僅乃截至上述日期,或會隨市況變化而改變,可予更改而毋須另行通知。該等意見可能有別於其他荷寶投資專業人士之意見。因使用本材料或當中所載任何評論、意見或估算而引致之直接、間接或相應損失,荷寶概不承擔法律責任。荷寶並無責任更新本網站或任何網站內容。未經荷寶事先書面許可,不得複製、分發或刊發本網站任何材料。 除非另有說明,資料來源:荷寶。