PhD, Head of Sustainable Index Solutions

• 市場觀點
‘Carbon beta is an additional climate risk indicator above and beyond traditional carbon data’
Research findings on a novel measure of climate risk – carbon beta – were presented at a prestigious National Bureau of Economic Research (NBER) conference. We discuss this with Joop Huij, Head of Sustainable Index Solutions at Robeco, and Dries Laurs, Sustainable Index Solutions Researcher.
作者


Researcher

Investment Specialist
概要
- Carbon beta incorporates forward-looking information on climate risk
- The metric provides insights on firms’ preparedness (leaders versus laggards) for the transition
- It can potentially complement carbon emissions data as a portfolio climate risk control
Dries, can you briefly tell us about yourself and the innovative research project you were involved in?
Dries Laurs: “Sure. As a member of the Robeco PhD program, I’m a researcher in the Sustainable Index Solutions team and a PhD candidate at Vrije Universiteit Amsterdam. For my PhD research, I’m focusing on how climate change affects financial markets and how investors can deal with this issue. In line with this, I recently co-authored my first paper1 with two professors from the university, Philip Stork and Remco Zwinkels, as well as Joop Huij, who is one of my PhD supervisors and Head of Sustainable Index Solutions at Robeco. Our study is on ‘carbon beta’ which is a market-based indicator of climate risk. This measure reflects how assets, for example global equities or commodities, comove with a carbon risk factor. The results from our research validated our concept and we were also invited to present our paper at an NBER conference.”
What does the Robeco PhD program entail?
Joop Huij: “People are at the heart of any asset management business. Therefore, Robeco always looks to recruit the best talent. As a part-time professor of finance at the Rotterdam School of Management, I have the privilege of teaching many students. This platform allows me to ‘scout’ for exceptional candidates who can potentially participate in our PhD program at Robeco. We set up this initiative several years ago and its success is characterized by the hugely impactful research the company has benefited from. With Dries, we are lucky to have another top talent and this is clearly reflected by his work on the carbon beta research project and the invitation he received to present at an NBER conference.”
What is the carbon beta paper about?
D.L.: “In our paper, we introduce a measure of asset-level climate risk exposure that is determined by how an asset’s return is correlated with a carbon risk factor. An asset with a negative carbon beta, for example, tends to have high returns when carbon risks increase. Such an asset can be seen as a ‘climate hedge’ as it pays off in times when investors are especially concerned about climate change. The opposite is true for an asset with a high carbon beta as it typically has low returns when carbon risks increase. We test our concept in several ways. First, we extensively validate our carbon beta estimates. For instance, we find the highest carbon betas in the energy, materials and utilities sectors. These industries generally have very high emissions. We also observe robust associations between carbon beta and emissions, emission intensities, green scores, and academic measures of climate change exposure.
Figure 1 | Average carbon beta per industry group
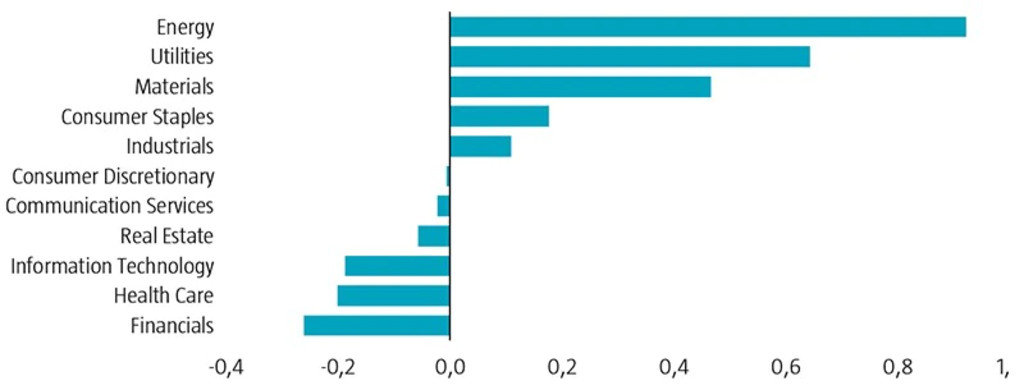
Source: The sample consists of common equities in the CRSP-Compustat universe traded on the NYSE, Nasdaq, or AMEX. The sample period is from January 2007 to December 2020.
“Second, we investigate the predictive ability of carbon beta for asset returns around periods associated with materializing climate risk. In establishing a proxy for such materializations, we focus on the textual similarities of authoritative texts on climate change – for example frequently used word combinations in Intergovernmental Panel on Climate Change (IPCC) reports – with articles in the Wall Street Journal in a month. Thus, we assume that months with high volumes of news linked to climate change indicate uncertainty around future climate policy. In mapping out US climate policy uncertainty over time, we see spikes in uncertainty during Conference of the Parties (COP) events, after the publication of major IPCC reports on climate, and around the elections of both Donald Trump and Joe Biden. We find that stocks with higher carbon betas have lower returns in these periods of elevated climate risk, and vice versa. Similarly, we also assume negative realizations of climate risk in months with unusually high temperatures or extreme drought conditions and observe a similar effect on stock returns.”
Figure 2 | US Climate Policy Uncertainty Index
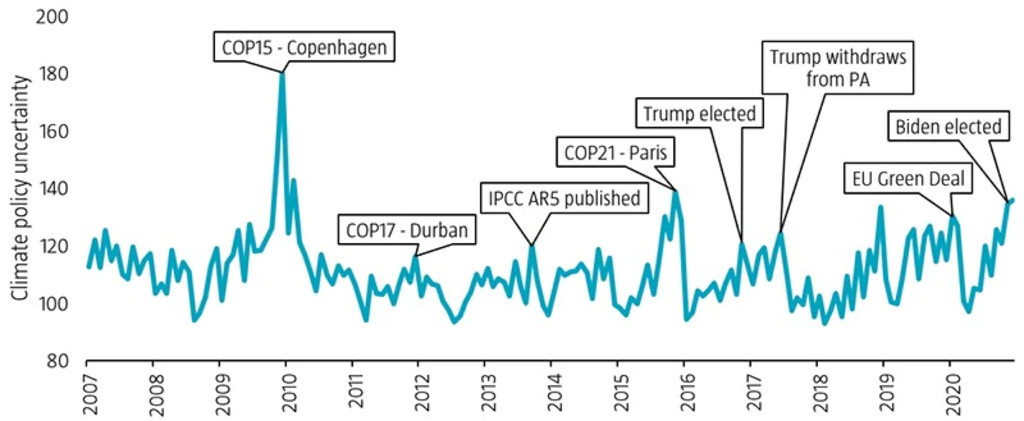
Source: The sample consists of common equities in the CRSP-Compustat universe traded on the NYSE, Nasdaq, or AMEX. The sample period is from January 2007 to December 2020.
“In our study, we find that these events associated with elevated climate risk typically result in stocks with higher carbon betas experiencing lower returns. Lastly, we look into green innovation and find that within industries, companies with lower carbon betas are usually more active in patenting green technologies. This relationship, however, does not exist when one analyzes a firm’s emissions or emission intensity. Therefore, we believe carbon beta is an additional climate risk indicator above and beyond traditional carbon data.”
Figure 3 | Average annualized returns for US stocks with low, neutral and high carbon beta in months with high climate policy uncertainty
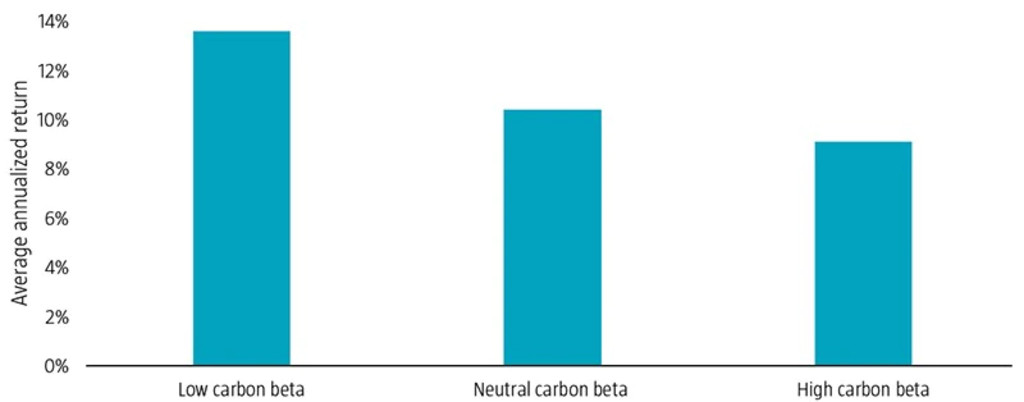
Source: Climate policy uncertainty is determined by the textual similarities between authoritative texts on climate change and articles in the Wall Street Journal. The sample period is from January 2007 to December 2020.
What are the advantages of carbon beta compared with traditional carbon emissions data?
J.H.: “We see carbon beta as a tool for climate risk management. In terms of its advantages over carbon emissions data, carbon beta incorporates current market-based information (no two-year lag) and market expectations, thus making it a more actual and perhaps even forward-looking measure. Carbon beta has wide coverage, as market data is available for virtually all listed companies, and has high transparency, as it is not dependent on voluntary disclosures. And perhaps its most attractive feature is that it not only identifies companies that are vulnerable (laggards) to the low-carbon transition, but also identifies those that are expected to benefit (leaders) from it. This is something generic emission characteristics are unable to do.”
So what’s the most practical implication from your study?
D.L.: “There are some pertinent takeaways from our findings on carbon beta and green innovation. In line with previous research2, we confirm in our paper that green innovation is driven primarily by the energy and materials sectors. Within these industries, the more innovative firms have lower carbon betas, although they do not necessarily have lower reported carbon emissions or emission intensities. In other words, investors should not just simply divest from these high carbon emitters as these ‘green innovators’ are essential for the energy transition. Therefore, holding these types of firms is likely to lower the climate risk of a portfolio.”
“We find that some companies that look ‘clean’ based on their low reported emissions data actually have a high carbon beta. For example, some smaller firms that provide services to the oil & gas sector do not have high-carbon emitting operations, but they are economically vulnerable to a low-carbon transition. By contrast, some businesses considered to be ‘high-polluting’ based on their high reported emissions data in fact have a low carbon beta as they are better prepared for the transition. For instance, this could be due to them actively researching green technologies. A good example is a US multinational that is active in the field of power generation. Despite ranking in the top 5% of greenhouse gas emitters in our sample, it is also one of the top three issuers of green patents. Thus, its carbon beta is among the lowest in the industrials sector.”
What will Robeco do with these findings?
J.H.: “Alongside our climate strategist, Lucian Peppelenbos, we are currently investigating if carbon beta can function as an additional measure of climate risk within Robeco’s climate analytics toolkit. We believe carbon beta complements the current toolkit as it provides insights on carbon risk above and beyond those garnered from traditional carbon emissions data. Indeed, carbon beta has forward-looking information embedded in it, while carbon emissions data is backward-looking in nature. We also believe that the carbon beta metric can provide value for outlining portfolio climate risks. Whereas climate value at risk measures are based on complex, opaque models, carbon beta is a more intuitive, transparent and straightforward measure. Hence, we will also explore whether it can be integrated in Robeco’s investment strategies as a climate risk control.”
Footnotes
1 Huij, J., Laurs, D., Stork, P. A., and Zwinkels, R. C. J., November 2021, “Carbon beta: a market-based measure of climate risk“, SSRN working paper.
2 Cohen, L., Gurun, U. G., and Nguyen, Q., January 2021, “The ESG-innovation disconnect: evidence from green patenting”, SSRN working paper.
In defining sustainability, investors have a multitude of dimensions and metrics they could consider. For example:
Values-based exclusions
ESG integration
Impact investing
ESG scores typically put more focus on the operations of a business, whereas SDG scores also incorporate the impact that the business’ products and/or services have on society.
We see client sustainability objectives increasingly moving towards avoiding controversial businesses (values-based exclusions) and including those that provide sustainable solutions (impact investing). In the first few articles of our Indices Insights series, we will empirically show how the different sustainability metrics (negative screening/exclusions, ESG, SDG) relate to these increasingly impact-oriented client sustainability objectives.
重要資料
本網站僅供《證券及期貨條例》(香港法例第571章)及其附屬法例所界定之專業投資者瀏覽及使用。 投資涉及風險。過往表現並不代表未來表現。本網站所載資料僅供參考之用,並不構成任何投資建議,亦非作出買賣任何證券或採納任何投資策略之要約或招攬。投資者不應僅憑本網站提供之資料作出投資決定,在作出任何投資決定前,應徵詢獨立意見(包括有關稅務影響之意見)。投資者應確保完全理解投資產品的相關風險,亦應考量自身投資目標及風險承受水平。投資乃閣下之個人決定。除非銷售投資產品的中介人已向閣下告知該投資產品適合閣下,並已解釋其符合閣下投資目標之原因,否則閣下不應投資。請參閱相關發售文件或其他法律文件,以獲取包括風險因素在內的進一步詳情。 本網站由荷寶投資管理香港有限公司發布,該公司受香港證券及期貨事務監察委員會(「證監會」)規管(中央編號:APU851)。本網站未經證監會審閱。 無法保證任何投資產品可實現其投資目標。概不就任何投資產品之表現或投資回報作任何聲明或承諾。投資的價值或會波動。本網站所載過往表現、推算或預測,均不應視作未來表現之保證或指標,且概不提供任何明示或暗示之保證。本網站內容建基於相信為可靠之來源,惟因應資料傳遞技術特性及須採用多項數據來源(包括第三方內容),故概不保證其準確性。所述觀點僅乃截至上述日期,或會隨市況變化而改變,可予更改而毋須另行通知。該等意見可能有別於其他荷寶投資專業人士之意見。因使用本材料或當中所載任何評論、意見或估算而引致之直接、間接或相應損失,荷寶概不承擔法律責任。荷寶並無責任更新本網站或任何網站內容。未經荷寶事先書面許可,不得複製、分發或刊發本網站任何材料。 除非另有說明,資料來源:荷寶。