Chief Researcher

概要
- 2010-2019 was a lost decade for the Fama-French factors
- Alternative factors did deliver over the same period
- Some factors such as low-risk even had a great decade
The period 2010 to 2019 was a lost decade for the factors in Professors Eugene Fama and Kenneth French’s widely used five-factor model. Over this period, the equity factors – value, size, profitability and investment – delivered a negative return on average, while the return on each individual factor was well below its long-term average. Nevertheless, dismissing factor investing altogether based solely on these results would be short-sighted.
The dismal performance between 2010 and 2019 is not unprecedented. New research by Robeco shows that the returns in this period were actually remarkably similar to those generated between 1990 and 1999. Yet this did not prevent them from making a strong comeback in the following decade. Moreover, we find that many time-tested alternative equity factors which are not considered in the Fama-French model did generate positive performance between 2010 and 2019.
The performance of the Fama-French factors before and after 2010 can be seen in the chart below. In the most recent decade (2010-2019), the return on each of these factors was well below its long-term average. Size and value even experienced a negative decade, with the latter performing so poorly that it prompted a series of empirical studies into whether the value premium might have disappeared for good.
Figure 1: Performance of the Fama-French factors
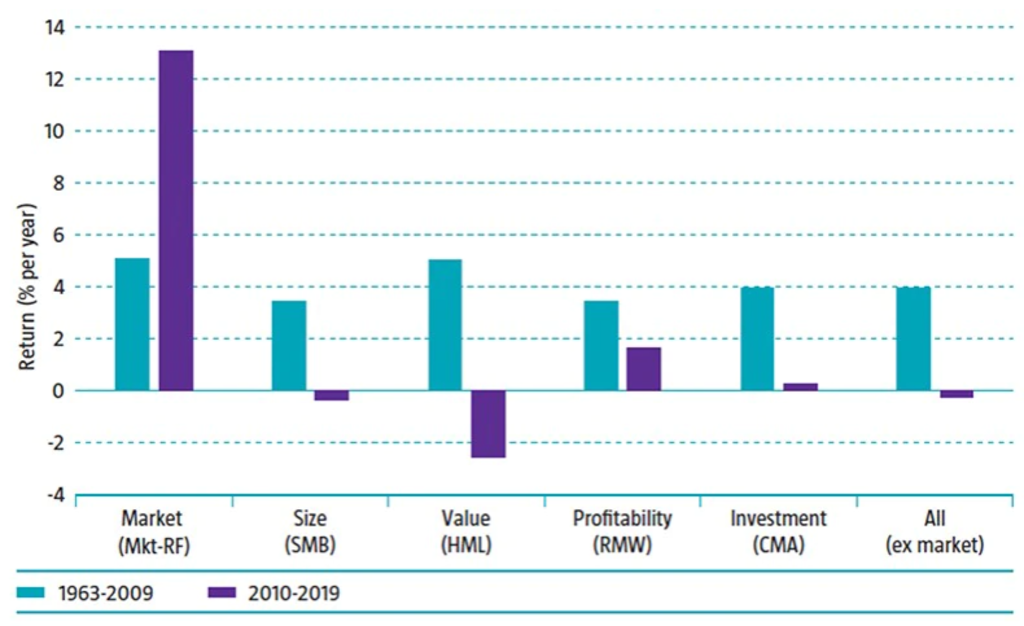

Source: Robeco, Kenneth French Data Library. Sample period: July 1963 to December 2019.
Size and value weren’t the only factors to have a rough ride. Over the past decade, the premium on the investment factor also failed to materialize, with a return close to zero. Only the profitability factor generated a positive return, but this premium was only around half the size it had been before 2010.
The weak performance of these two newly added factors is particularly striking, since they were introduced in Fama and French’s 2015 study, which used data until the end of 2013. In other words, part (40%) of the most recent – disappointing – decade was taken into account in the study that proposed the two new factors.

Other factors in French’s data library
However, these are not the only factors out there. The data library maintained by Kenneth French also tracks the performance of various factors that are not considered in the five-factor model. These include three alternative value metrics of earnings-to-price, cash-flow-to-price and dividend yield.
Then there is 12-to-one-month price momentum; short-term reversal; using net share issuance as an alternative investment factor; and the change in operating working capital to book value (accruals). Finally, there are three low-risk factors: 60-month market beta, 60-day variance and 60-day residual variance. The performance of these factors is shown in the chart below.
Figure 2: Performance of the other factors in Kenneth French’s data library
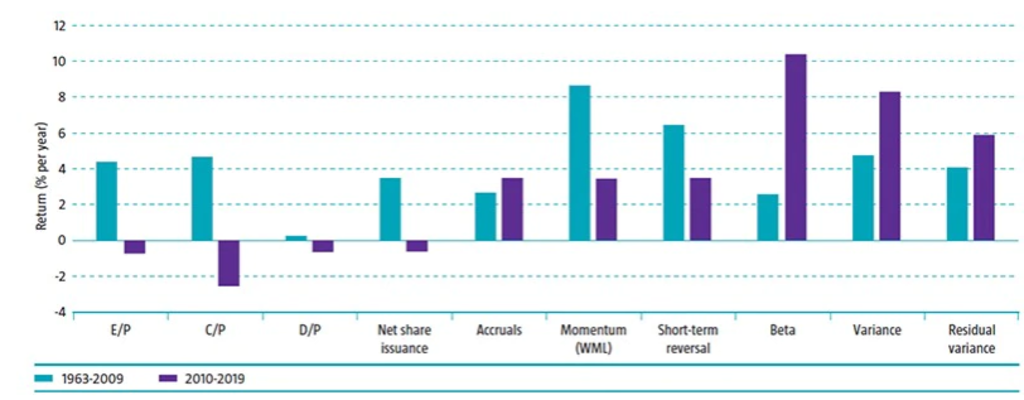
Source: Robeco, Kenneth French Data Library. Sample period: July 1963 to December 2019.
The three alternative value metrics all had a negative return over the last decade, similar to Fama and French’s conventional value factor of high-minus-low (HML). The alternative investment factor, net share issuance, also ended up in negative territory.
With a return of 3.5% for the period from 2010 to 2019, the accruals factor fared better and even generated a slightly higher return than in the preceding period. This is consistent with a study carried out in 2016, also by Fama and French, which found that the five-factor model has difficulties explaining the performance of accruals portfolios. Results for the period from 2010 to 2019 confirm that the accruals factor can do well when the Fama-French factors struggle.
(Lack of) momentum
Turning to momentum, this is a factor that is often used to augment the Fama-French factor models; for example, by turning the five-factor model into a six-factor one. Momentum returned a shocking -82% in 2009, turning 2000 to 2009 into a lost decade for the factor.
However, for the period from 2010 to 2019, we observe an average premium of around 3.5% for momentum. Although below the long-term average, this is still well within positive territory. So, it seems premature to discard momentum altogether. Interestingly, the factor also saw its best decade between 1990 and 1999 – the other tough decade for Fama and French’s factors.
Meanwhile, the short-term reversal factor delivered a return of around 3.5% in the last decade, which, like for momentum, is below its long-term average, but well above zero. Most notable, however, are the three low-risk factors, which generated premiums of around 6 to 10% in the period from 2010 to 2019. This makes it the second-best decade ever for low risk, after 1980 to 1989.
The Hou-Xue-Zhang factors
Then there is the data library maintained by finance professors Kewei Hou, Chen Xue and Lu Zhang. It contains value-weighted decile portfolios for about 50 individual factors taken from their 2020 paper, ‘Replicating anomalies’. Since most of these factors were first documented well before 2010, the past decade enables us to test them outside the sample period that was originally used.
To that end, we combined closely related factors into composite factors by averaging their returns, which brings down the number of factors to 13. For instance, five separate seasonal factors were combined into one composite seasonal factor. The performance of these composite factors is shown in the chart below.
Figure 3: Performance of the factors in the Hou-Xue-Zhang data library
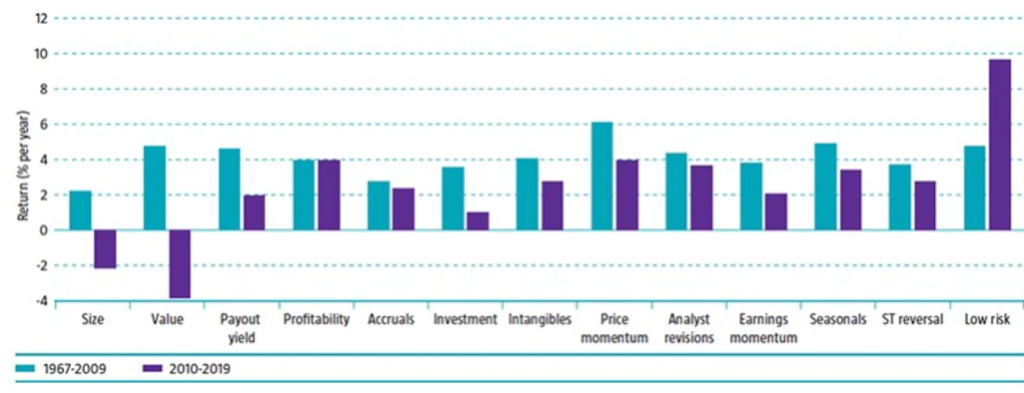
Source: Robeco, Hou-Xue-Zhang data library. Sample period: January 1967 to December 2019.
Consistent with the previous results, the composite size and value factors exhibit a negative premium for the most recent decade. Remarkably, however, the other 11 composite factors all exhibit positive returns for 2010 to 2019: payout yield, profitability, accruals, investment, intangibles, price momentum, analyst revisions, earnings momentum, seasonals, short-term reversal and low risk.
For profitability, price momentum, short-term reversal and low risk, these results confirm earlier findings for the Fama-French versions of these factors. The main takeaway is that while the Fama-French factors experienced a lost decade between 2010 and 2019, many alternative factors actually had a decent or, in some cases, even very good recent decade.
This article is an excerpt of a special topic in our five-year outlook.
重要資料
本網站僅供《證券及期貨條例》(香港法例第571章)及其附屬法例所界定之專業投資者瀏覽及使用。 投資涉及風險。過往表現並不代表未來表現。本網站所載資料僅供參考之用,並不構成任何投資建議,亦非作出買賣任何證券或採納任何投資策略之要約或招攬。投資者不應僅憑本網站提供之資料作出投資決定,在作出任何投資決定前,應徵詢獨立意見(包括有關稅務影響之意見)。投資者應確保完全理解投資產品的相關風險,亦應考量自身投資目標及風險承受水平。投資乃閣下之個人決定。除非銷售投資產品的中介人已向閣下告知該投資產品適合閣下,並已解釋其符合閣下投資目標之原因,否則閣下不應投資。請參閱相關發售文件或其他法律文件,以獲取包括風險因素在內的進一步詳情。 本網站由荷寶投資管理香港有限公司發布,該公司受香港證券及期貨事務監察委員會(「證監會」)規管(中央編號:APU851)。本網站未經證監會審閱。 無法保證任何投資產品可實現其投資目標。概不就任何投資產品之表現或投資回報作任何聲明或承諾。投資的價值或會波動。本網站所載過往表現、推算或預測,均不應視作未來表現之保證或指標,且概不提供任何明示或暗示之保證。本網站內容建基於相信為可靠之來源,惟因應資料傳遞技術特性及須採用多項數據來源(包括第三方內容),故概不保證其準確性。所述觀點僅乃截至上述日期,或會隨市況變化而改變,可予更改而毋須另行通知。該等意見可能有別於其他荷寶投資專業人士之意見。因使用本材料或當中所載任何評論、意見或估算而引致之直接、間接或相應損失,荷寶概不承擔法律責任。荷寶並無責任更新本網站或任何網站內容。未經荷寶事先書面許可,不得複製、分發或刊發本網站任何材料。 除非另有說明,資料來源:荷寶。