Chief Researcher


• インサイト
The many faces of growth
Quantitative investing is inspired on the insight that certain stock characteristics – or factors – are associated with higher long-term returns. Value, momentum, quality, and low risk are widely recognized as offering robust, persistent premiums. But what about growth? Is it a factor in its own right, or simply a shapeshifter, taking on different roles depending on how it's defined?
執筆者


主なキーワード
まとめ
- Investors often wonder: Is there a distinct growth factor premium?
- Growth can be the opposite of value, a dimension of quality, or business momentum
- Expected premium can be negative, flat, or positive depending on the definition
Our recent research explores three main definitions of growth and examines whether any of them justify treating it as a standalone alpha factor.
In the academic literature, growth is often defined as the opposite of value. Value strategies favor stocks with low valuation multiples (like price-to-earnings or price-to-book), while growth stocks tend to be expensive by those same metrics. Historically, stocks with high valuation multiples have underperformed, implying a negative growth premium under this definition.
That doesn’t mean quants avoid growth entirely. In a multi-factor model, valuation is only one input. An expensive stock might still earn a place in the portfolio if it scores highly on other factors such as momentum or quality. Similarly, a cheap stock could be excluded if it looks like a value trap. In real life, of course, practitioners do not usually define growth as the polar opposite of value, with growth investors in particular seeing their objective as being to identify stocks likely to deliver (even) more growth than priced in by the market.
2. Growth as a dimension of Quality
Quants are quite familiar with the kind of earnings and sales growth metrics used by MSCI or fundamental investors, but usually consider these to be a potential dimension within a broader quality factor. Here, the strength of company fundamentals is considered without the corresponding price tag; something that also applies to growth metrics.
Indeed, both quality and growth stocks tend to be more expensive. Historical valuation data for the MSCI World Quality Index confirms that it consistently trades at higher valuations than the broader market, regardless of the valuation metric used. This overlap strengthens the argument for treating growth as part of the quality family rather than a separate factor.
However, for growth to stand alone as a quant factor, it must be both clearly distinct and deliver strong returns. Historical data from the Jensen, Kelly, and Pedersen factor library, which spans over 60 years of US stock returns, suggests otherwise. Figure 1 shows that while value, momentum, and quality factors all show annual premiums of 5 to 7%, growth-related factors fare worse: profitability growth delivers just 2%, and sales growth even shows a negative return of -2%.
Figure 1 | Historical performance of selected US factors, July 1963 to December 2023
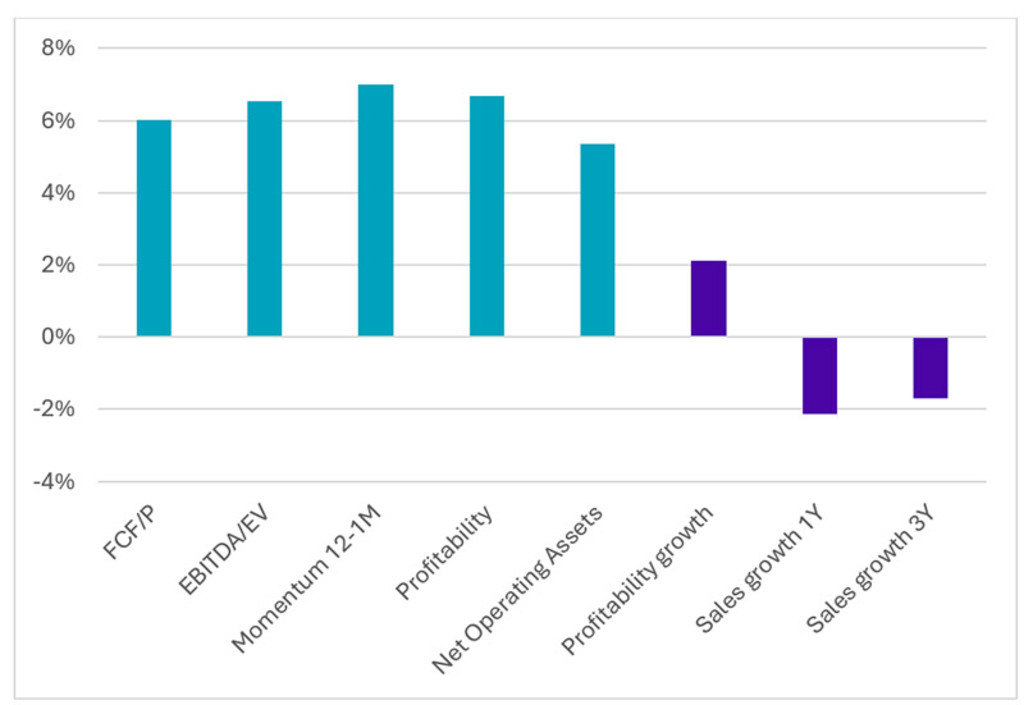
Source: Jensen, Kelly, and Pedersen factor library. July 1963-2023. This chart is for illustrative purposes only and does not represent an actual product or strategy.
Furthermore, in our research on the factor zoo, we found that growth factors fail to make it into the top 15. Figure 2 shows how, in one of our Enhanced Indexing strategies, exposures towards growth factors are marginally positive on average but dwarfed by the exposures to other factors.
Figure 2 | Exposures of Robeco Global Developed Markets Enhanced Indexing strategy to generic factors, July 2024
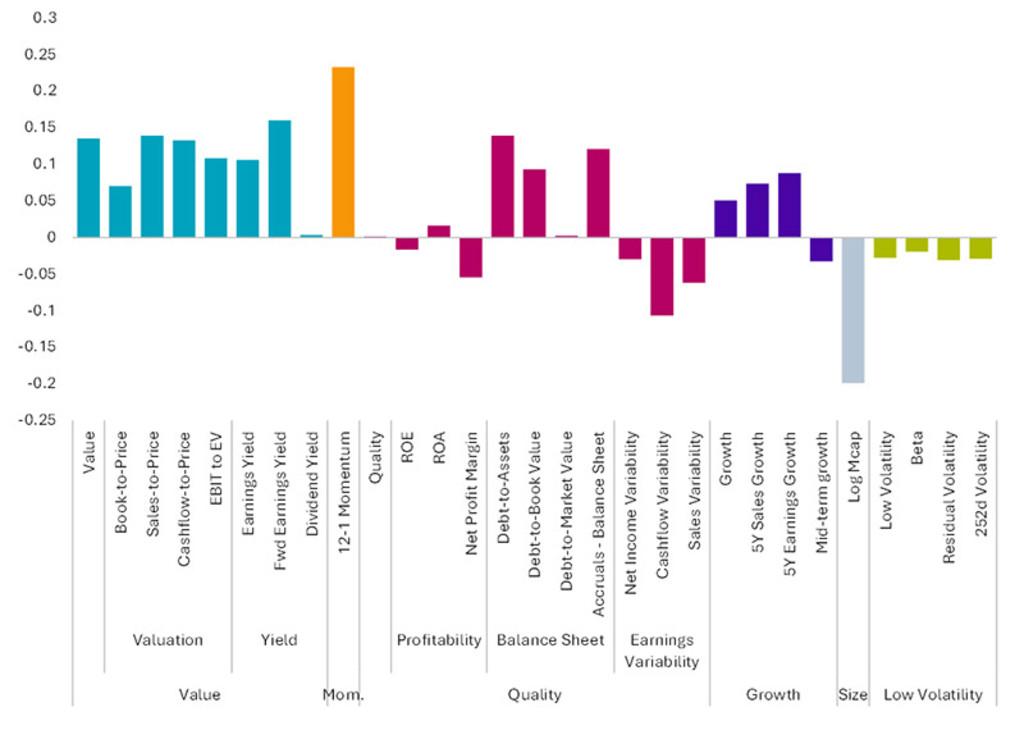
Source: Robeco. July 2024. This chart is for illustrative purposes only.
クオンツ運用の価値を探求
最先端クオンツ戦略の情報やインサイトを定期的にお届けします。
3. Growth as Business Momentum
In practice, the concept of growth is open to many more interpretations, which may help explain why it’s prominent in the models of some quant managers.
The wide range of academic definitions of growth add another layer of complexity, where signals grouped under the ‘growth’ umbrella aren’t always obviously related. For example, Jensen, Kelly, and Pedersen1 use statistical clustering to group over 150 factors into 13 categories. One cluster, labeled ‘profit growth’, includes traditional growth metrics but also momentum-like signals, such as seasonal return patterns and earnings surprises. Other studies, like Hou, Mo, Xue, and Zhang’s2 expected growth factor, blur the line further, with ‘growth’ metrics overlapping heavily with profitability factors.
Indeed, many signals that relate to short-term market sentiment or business momentum may be labeled growth, including analyst revisions, credit card data, job postings, or media sentiment. These short-term indicators reflect changing expectations about a company’s future prospects – arguably a form of growth. This perspective can justify an expected premium for growth that is positive, while bearing in mind that an improved short-term outlook may be quite different from long-term earnings and sales growth pathways.
Conclusion
When discussing growth as an alpha factor, it’s essential to ask: what kind of growth? If growth is simply the opposite of value, the expected premium is negative. If it’s defined as past or forecasted earnings and sales growth, the premium is weak or nonexistent. If it’s understood as short-term sentiment or business momentum, the outlook may be more positive – but then the label ‘growth’ may not really fit.
Footnotes
1 See their factor library at https://onlinelibrary.wiley.com/doi/full/10.1111/jofi.13249 for more information.
2 See https://global-q.org/uploads/1/2/2/6/122679606/q5rf2021.pdf.
重要事項
当資料は情報提供を目的として、ロベコ・ジャパン株式会社(以下「当社」)が独自に作成、または当社のグループ会社(Robeco Institutional Asset Management B.V.およびその関連会社を含む)から提供された資料を当社が編集・翻訳したものです。資料中の個別の金融商品の売買の勧誘や推奨等を目的とするものではありません。記載された情報は十分信頼できるものであると考えておりますが、その正確性、完全性を保証するものではありません。意見や見通しはあくまで作成日における弊社の判断に基づくものであり、今後予告なしに変更されることがあります。運用状況、市場動向、意見等は、過去の一時点あるいは過去の一定期間についてのものであり、過去の実績は将来の運用成果を保証または示唆するものではありません。また、記載された投資方針・戦略等は全ての投資家の皆様に適合するとは限りません。当資料は法律、税務、会計面での助言の提供を意図するものではありません。 ご契約に際しては、必要に応じ専門家にご相談の上、最終的なご判断はお客様ご自身でなさるようお願い致します。 運用を行う資産の評価額は、組入有価証券等の価格、金融市場の相場や金利等の変動、及び組入有価証券の発行体の財務状況による信用力等の影響を受けて変動します。また、外貨建資産に投資する場合は為替変動の影響も受けます。運用によって生じた損益は、全て投資家の皆様に帰属します。したがって投資元本や一定の運用成果が保証されているものではなく、投資元本を上回る損失を被ることがあります。弊社が行う金融商品取引業に係る手数料または報酬は、締結される契約の種類や契約資産額により異なるため、当資料において記載せず別途ご提示させて頂く場合があります。具体的な手数料または報酬の金額・計算方法につきましては弊社担当者へお問合せください。 当資料及び記載されている情報、商品に関する権利は弊社に帰属します。したがって、弊社の書面による同意なくしてその全部もしくは一部を複製またはその他の方法で配布することはご遠慮ください。 商号等: ロベコ・ジャパン株式会社 金融商品取引業者 関東財務局長(金商)第2780号 加入協会: 一般社団法人 資産運用業協会