Chief Researcher


• 市場觀點
Decomposing equity returns: Earnings growth versus multiple expansion
Over the past decade, the stock market has been dominated by the US economy, led by big tech and driven by strong earnings growth and multiple expansion. Companies such as Apple, Microsoft, and Nvidia have fueled this rally, pushing US equities to record weights in global indices and high valuations versus historical norms and other markets. Compared to US growth stocks, European equities, emerging markets (EM), value stocks, low-volatility stocks, and small-cap stocks appear relatively cheap. But do these alternatives present the same investment case?
作者



概要
- US equities led due to strong growth and valuation expansion
- Small-cap and low-volatility stocks had strong fundamentals but lacked market appreciation
- Emerging markets struggled with weak earnings, except for Taiwan and India
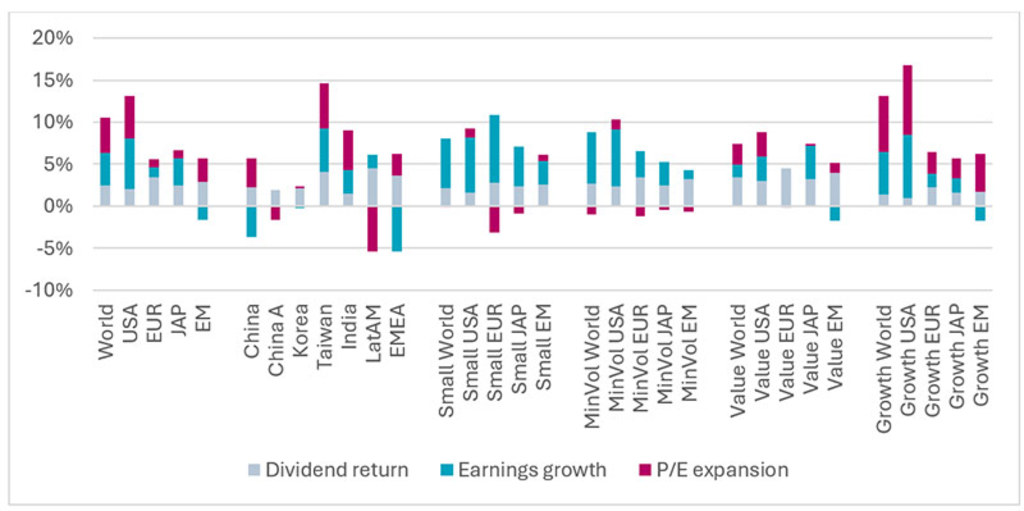
To explore this, we decompose equity returns into earnings growth and multiple expansion. This analysis highlights key differences behind underperformance. Small-cap and low volatility stocks delivered strong earnings growth but lagged due to stagnant valuations. EM equities, however, struggled due to weak earnings growth, despite rising valuations. Taiwan and India were exceptions, posting solid earnings growth, though not enough to offset poor performance from China, Korea, and EMEA.
Ultimately, small-cap and low volatility stocks suffer from a lack of investor appreciation, while EM equities need a turnaround in operating performance.
Figure 1 | Decomposition of annualized total returns 2015-2024
Source: MSCI, Robeco. This chart is for illustrative purposes only.
Our approach follows John Bogle’s return decomposition formula:
Return = Dividend Yield + Earnings Growth +/- Change in P/E Ratio
This framework helps distinguish between returns driven by fundamentals – dividends and earnings growth – and those influenced by valuation changes. We applied this method to MSCI country and style indices over a ten-year period (2015-2024) to analyze regional and style-based return drivers.
US equities outperformed
The US market led global performance, benefiting from both the highest earnings growth and significant multiple expansion.Europe & Japan: modest growth, little valuation expansion
These regions saw lower earnings growth and little multiple expansion, leading to weaker total returns.EM struggled, with some exceptions
Despite rising valuations, EM equities suffered from weak or even negative earnings growth. Taiwan and India posted strong earnings, but underperformance in China, Korea, and EMEA weighed on the region. LatAm struggled due to multiple contraction.Small-cap and low volatility stocks: strong earnings, but out of favor
Small-cap stocks consistently delivered stronger earnings growth than large caps. Based purely on fundamental returns, European small caps led all indices. However, their stagnant valuations constrained total returns, particularly in the US. Similarly, low volatility stocks posted robust earnings growth but failed to see valuation increases.Value vs. growth stocks: US growth stocks dominate
US growth stocks outperformed, fueled by both earnings growth and multiple expansion. Even US value stocks beat growth stocks in Europe, Japan, and EM. In EM, both value and growth stocks suffered negative earnings growth, though EM growth stocks benefited more from multiple expansion, while EM value stocks gained from dividends.
Is a turnaround in sight?
US growth stocks are still going strong. Although earnings growth dipped in 2019-2020 and valuations contracted in 2021-2022, both have since rebounded. However, EM equities have shown little sign of a sustained recovery, with earnings stuck in a cyclical but flat trend.
What does this mean for investors? History suggests that dividends and earnings growth are the main driver of long-term returns, with valuation multiples prone to mean-reverting. While US growth stocks may continue to lead, the healthy fundamentals of small-cap and low volatility stocks indicate potential future opportunities. Earnings in EM will also rebound at some point, and, if the US earnings cycle peaks, US stocks could face multiple contraction.
Rather than extrapolating past trends, investors should prepare for a shifting market environment. A well-diversified portfolio across regions, sectors, and asset classes remains essential for resilience, regardless of how the next decade unfolds.
獲取最新市場觀點
訂閱我們的電子報,時刻把握投資資訊和專家分析。
重要資料
本網站僅供《證券及期貨條例》(香港法例第571章)及其附屬法例所界定之專業投資者瀏覽及使用。 投資涉及風險。過往表現並不代表未來表現。本網站所載資料僅供參考之用,並不構成任何投資建議,亦非作出買賣任何證券或採納任何投資策略之要約或招攬。投資者不應僅憑本網站提供之資料作出投資決定,在作出任何投資決定前,應徵詢獨立意見(包括有關稅務影響之意見)。投資者應確保完全理解投資產品的相關風險,亦應考量自身投資目標及風險承受水平。投資乃閣下之個人決定。除非銷售投資產品的中介人已向閣下告知該投資產品適合閣下,並已解釋其符合閣下投資目標之原因,否則閣下不應投資。請參閱相關發售文件或其他法律文件,以獲取包括風險因素在內的進一步詳情。 本網站由荷寶投資管理香港有限公司發布,該公司受香港證券及期貨事務監察委員會(「證監會」)規管(中央編號:APU851)。本網站未經證監會審閱。 無法保證任何投資產品可實現其投資目標。概不就任何投資產品之表現或投資回報作任何聲明或承諾。投資的價值或會波動。本網站所載過往表現、推算或預測,均不應視作未來表現之保證或指標,且概不提供任何明示或暗示之保證。本網站內容建基於相信為可靠之來源,惟因應資料傳遞技術特性及須採用多項數據來源(包括第三方內容),故概不保證其準確性。所述觀點僅乃截至上述日期,或會隨市況變化而改變,可予更改而毋須另行通知。該等意見可能有別於其他荷寶投資專業人士之意見。因使用本材料或當中所載任何評論、意見或估算而引致之直接、間接或相應損失,荷寶概不承擔法律責任。荷寶並無責任更新本網站或任何網站內容。未經荷寶事先書面許可,不得複製、分發或刊發本網站任何材料。 除非另有說明,資料來源:荷寶。