Researcher
Active Quant: finding alpha with confidence
Blending data-driven insights, risk control and quant expertise to pursue reliable returns.






In professional sports, it’s well known that small, consistent advantages add up to long-term success. The same principle applies to investing. In this insight, we compare the hit ratio of one of the greatest tennis players of all time, Roger Federer, to that of our Enhanced Indexing strategies, and highlight what it takes to stay at the top of your game







Earlier this year, Roger Federer gave an insightful commencement address at Dartmouth College.1 Reflecting on his tennis career, Federer revealed an intriguing statistic: despite winning nearly 80% of his more than 1,500 singles matches, he won just 54% of all points played. This means that even for one of the most dominant tennis players of all time, the likelihood of winning a single point is comparable to a coin flip. However, it also means that gaining a small competitive advantage over and over, point by point, set by set, and match by match, gradually builds into a great success story.
Let’s explore how this analogy relates to the world of investing. Like Federer, our Enhanced Indexing strategies have shown a strong performance over their up to 20-year track record, with their small, incremental wins translating to robust outperformance over time. Imagine, if you will, a point corresponding to daily, a game to monthly, a set to yearly, and a match to multi-year hit ratios, i.e., the ratio showing a strategy has outperformed its corresponding benchmark.
Figure 1 shows these hit ratios for different investment horizons for both Robeco enhanced indexing equity and credit strategies. You can see clearly that the hit ratios increase with the investment horizons. While the daily hit ratios are all between 52% and 53% (so just slightly below Federer’s hit point win rate of 54%), these ratios increase to about 60% (monthly), 75% (quarterly), 80% (yearly), and, in the case of Enhanced Indexing in emerging market equities and investment grade credits, to 100% for five-year horizons.2
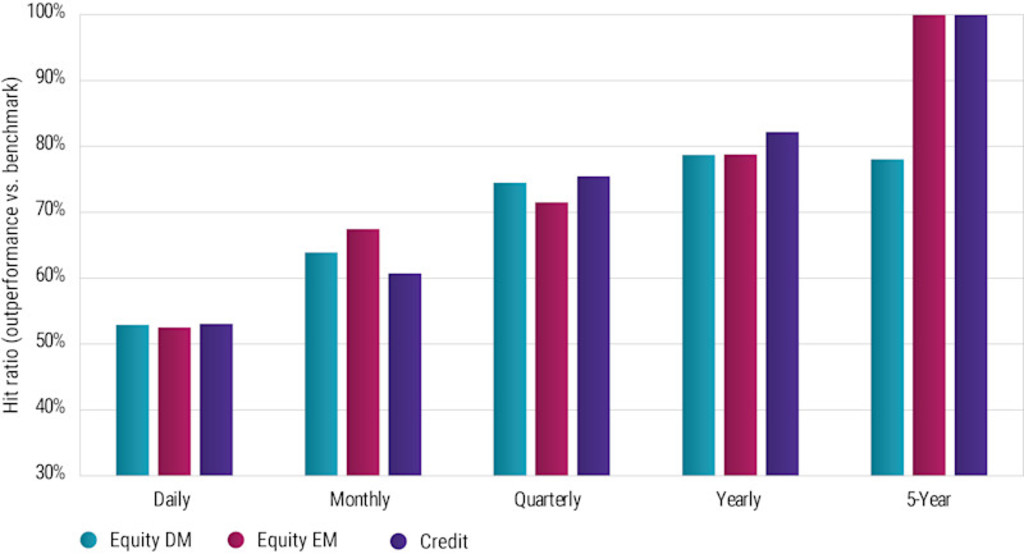
Source: Robeco, MSCI. The figure shows hit ratios over different frequencies for our Enhanced Indexing strategies for both developed markets (DM) and emerging markets (EM) equities as well as investment grade credit markets. The hit ratio for DM equities is based on the Robeco Composite Global Developed Enhanced Indexing versus the MSCI World Index (net dividends reinvested). For EM equities, it is based on the Robeco Composite Emerging Enhanced Indexing versus the MSCI Emerging Markets Index3(net dividends reinvested). For credit, it is based on the Robeco Composite Global Multi-Factor Credits (hedged into EUR) versus the Bloomberg Global Aggregate Corporates Index (hedged into EUR). All figures are in EUR. Data is from strategy inception4 to 29 November 2024. Further notes.5

Blending data-driven insights, risk control and quant expertise to pursue reliable returns.
This analysis shows that in investing, consistently applying a Federer-like edge can lead to extraordinary outcomes over time. However, like in professional sports, steady improvement is necessary to stay at the top of your game. For quant investing, this means the enhancement of existing factors. It also means integrating new signals based, for instance, on more short-term information, or the use of machine learning and natural language processing. Equally important is a portfolio construction algorithm that efficiently balances risk, return, and sustainability considerations while avoiding unnecessary turnover and unrewarded risks—ensuring that you bring the power of your engine (your quant model) effectively to the court.
[1] Federer, R. (2024) 2024 Commencement Address, Dartmouth College.
[2] Please note that this development is actually not that surprising. Assuming Federer’s point win rate of 54% as a daily hit ratio and assuming independent identically distributed hit ratios, one would expect hit ratios of 64.5%, 73.8%, 88.7%, and 99.8% for monthly, quarterly, yearly, and 5-year hit-ratios, respectively. However, slightly lower daily hit ratios of 53%, 52%, or 51% lead to 5-year hit ratios of ‘only’ 98%, 92%, and 75%, respectively. Furthermore, in real-life, investment returns are usually not independent and identically distributed.
[3] As of 1 January 2008, the benchmark changed from S&P/IFC EM Regional Investable Composite (net dividends reinvested) to the MSCI Emerging Markets index (net dividends reinvested).
[4] The inception of the Composite Global Developed Enhanced Indexing was in November 2004, and of the Composite Emerging Markets Enhanced Index Equities in July 2007. Daily hit ratios are based on data starting in January 2010. The inception of the Composite Global Multi-Factor Credits was in August 2015.
[5] Portfolios in the composite are based globally and can have different tax implications, which may impact performance figures. The value of your investments may fluctuate. Past performance is no guarantee of future results. Returns gross of fees, based on gross asset value. In reality, costs (such as management fees and other costs) are charged. These have a negative effect on the returns shown.
訂閱我們的電子報,時刻把握投資資訊和專家分析。
本網站僅供《證券及期貨條例》(香港法例第571章)及其附屬法例所界定之專業投資者瀏覽及使用。 投資涉及風險。過往表現並不代表未來表現。本網站所載資料僅供參考之用,並不構成任何投資建議,亦非作出買賣任何證券或採納任何投資策略之要約或招攬。投資者不應僅憑本網站提供之資料作出投資決定,在作出任何投資決定前,應徵詢獨立意見(包括有關稅務影響之意見)。投資者應確保完全理解投資產品的相關風險,亦應考量自身投資目標及風險承受水平。投資乃閣下之個人決定。除非銷售投資產品的中介人已向閣下告知該投資產品適合閣下,並已解釋其符合閣下投資目標之原因,否則閣下不應投資。請參閱相關發售文件或其他法律文件,以獲取包括風險因素在內的進一步詳情。 本網站由荷寶投資管理香港有限公司發布,該公司受香港證券及期貨事務監察委員會(「證監會」)規管(中央編號:APU851)。本網站未經證監會審閱。 無法保證任何投資產品可實現其投資目標。概不就任何投資產品之表現或投資回報作任何聲明或承諾。投資的價值或會波動。本網站所載過往表現、推算或預測,均不應視作未來表現之保證或指標,且概不提供任何明示或暗示之保證。本網站內容建基於相信為可靠之來源,惟因應資料傳遞技術特性及須採用多項數據來源(包括第三方內容),故概不保證其準確性。所述觀點僅乃截至上述日期,或會隨市況變化而改變,可予更改而毋須另行通知。該等意見可能有別於其他荷寶投資專業人士之意見。因使用本材料或當中所載任何評論、意見或估算而引致之直接、間接或相應損失,荷寶概不承擔法律責任。荷寶並無責任更新本網站或任何網站內容。未經荷寶事先書面許可,不得複製、分發或刊發本網站任何材料。 除非另有說明,資料來源:荷寶。
警告 — 有不法分子在網站及社交媒體上冒用荷寳 了解更多