Researcher


• 市場觀點
Quant chart: Outsmarting the crowd during index changes
The rise of passive investing in recent decades has been driven in part by its high level of transparency. However, this transparency has its drawbacks, such as the hidden costs related to the ‘index effect’. Robeco’s quant strategies offer the flexibility not only to avoid these pitfalls but to take advantage of them.
作者




Researcher



Portfolio Manager
Index changes – such as which companies will be added and removed – happen on a specified rebalance date and are announced by index providers in advance. Due to their requirement to closely track public indices, passive strategies are therefore vulnerable to index front-running, where active managers exploit the announced index changes in a way their passive counterparts cannot.
This leaves passive strategies to buy stocks at relative price peaks and sell at relative lows. The index effect describes this abnormal return pattern – where the stocks to be added to an index outperform in the days before the addition and underperform in the days after. A reverse pattern also holds for index deletions. These patterns have not only been documented for major indices such as the S&P 500, but also for factor indices.1

Active Quant: finding alpha with confidence
Blending data-driven insights, risk control and quant expertise to pursue reliable returns.
Passive is predictable for investors and competitors alike
Passive strategies are tasked with minimizing the tracking error to their respective benchmarks and, as such, tend to incorporate index changes only on the effective date. Conversely, active investors are free to trade after the announcement, which typically happens weeks in advance, or even earlier based on predicted index changes (using index methodology), with the knowledge that passive investors are obliged to follow the index.
While the increase in passive investing would seem likely to amplify these patterns, others argue that these have in fact declined, with market participants either increasingly trading on anticipated changes or by creating arrangements where other institutions stand ready to provide liquidity to indexers. 2
Figure 1 | Outsmart the crowd: Abnormal return around index additions
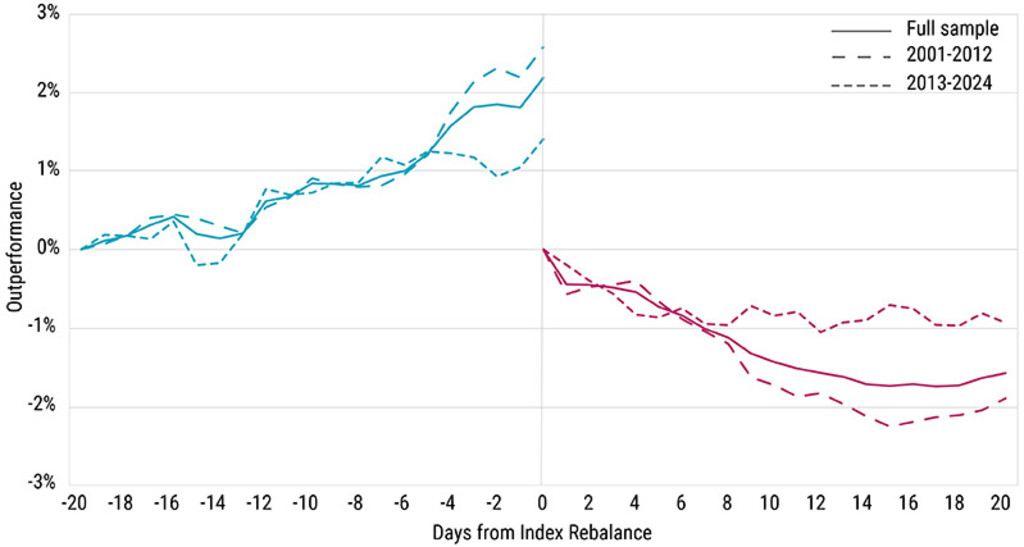
Source: Robeco, Refinitiv. The figure shows the average cumulative outperformance of additions to the MSCI World Index relative to the MSCI World Index around quarterly index rebalancing dates. t=0 is the rebalancing date at which we reset the cumulative performance to zero. The sample period is January 2001 to August 2024.
Quant Charts
Quantifying the index effect
Figure 1 revisits the index effect for the MSCI World Index additions from 2001 to 2024, showing the relative performance of the additions in the 20 days prior to and proceeding the index rebalance. It is clear that incoming stocks to the index outperform by about 2% before inclusion (t=0). However, after these stocks are added to the index, the outperformance is largely reversed, meaning that portfolios that trade directly upon the rebalance date buy these stocks at the worst moment.
This creates a hidden cost for passive investors, as the effect is embedded in the index, meaning they don’t underperform the benchmark but still bear the return impact. As a result, many investors remain unaware of how these dynamics affect their returns.
While we see that the patterns are more pronounced during the first half of our sample from 2001 to 2012, we still observe the index effect in the second half.3
Robeco’s quant strategies, such as Enhanced Indexing or more active strategies, have the flexibility to avoid these hidden costs by considering these effects when trading for our clients. While our proprietary stock selection models and risk management are the engine behind these strategies, a focus on practical portfolio management, optimal trading, and accounting for hidden costs such as the index effect is part of our ethos that every basis point counts. This agility enables Robeco investors to outsmart the crowd.
Footnotes
1 Cf., Shleifer, A. (1986), Do demand curves for stocks slope down? The Journal of Finance, 41(3), 579-590, Huij, J., & Kyosev, G. (2016), Price Response to Factor Index Additions and Deletions, SSRN Working Paper No. 2846982 ,and Blitz, D., & Marchesini, T. (2019), The Capacity of Factor Strategies, Journal of Portfolio Management, 45(6), 30-38.
2 Greenwood, R. M., & Sammon, M. (2024), The Disappearing Index Effect, The Journal of Finance, forthcoming.
3 In unreported results, we find similar but opposed patterns for index deletions, i.e., stocks announced to be removed from the index underperform before the actual rebalance and outperform after the rebalance.
探索量化價值
訂閱我們的電子報,獲取尖端的量化策略和見解。
重要資料
本網站僅供《證券及期貨條例》(香港法例第571章)及其附屬法例所界定之專業投資者瀏覽及使用。 投資涉及風險。過往表現並不代表未來表現。本網站所載資料僅供參考之用,並不構成任何投資建議,亦非作出買賣任何證券或採納任何投資策略之要約或招攬。投資者不應僅憑本網站提供之資料作出投資決定,在作出任何投資決定前,應徵詢獨立意見(包括有關稅務影響之意見)。投資者應確保完全理解投資產品的相關風險,亦應考量自身投資目標及風險承受水平。投資乃閣下之個人決定。除非銷售投資產品的中介人已向閣下告知該投資產品適合閣下,並已解釋其符合閣下投資目標之原因,否則閣下不應投資。請參閱相關發售文件或其他法律文件,以獲取包括風險因素在內的進一步詳情。 本網站由荷寶投資管理香港有限公司發布,該公司受香港證券及期貨事務監察委員會(「證監會」)規管(中央編號:APU851)。本網站未經證監會審閱。 無法保證任何投資產品可實現其投資目標。概不就任何投資產品之表現或投資回報作任何聲明或承諾。投資的價值或會波動。本網站所載過往表現、推算或預測,均不應視作未來表現之保證或指標,且概不提供任何明示或暗示之保證。本網站內容建基於相信為可靠之來源,惟因應資料傳遞技術特性及須採用多項數據來源(包括第三方內容),故概不保證其準確性。所述觀點僅乃截至上述日期,或會隨市況變化而改變,可予更改而毋須另行通知。該等意見可能有別於其他荷寶投資專業人士之意見。因使用本材料或當中所載任何評論、意見或估算而引致之直接、間接或相應損失,荷寶概不承擔法律責任。荷寶並無責任更新本網站或任何網站內容。未經荷寶事先書面許可,不得複製、分發或刊發本網站任何材料。 除非另有說明,資料來源:荷寶。