Portfolio Manager


• 市場觀點
Scope 3 emissions in real estate: The elephant in the room
Global real estate companies are often failing to measure or disclose Scope 3 emissions, and this is proving a hurdle when evaluating the sector’s path to net zero.
作者


Portfolio Manager

Research Analyst
概要
- Scope 3 greenhouse gas emissions remain underreported by the top 200 listed real estate companies, obscuring the path to net zero for the sector
- Only 56% of these property companies disclosed Scope 3 emissions, and more than half of those did not break down emissions at all
- Geographical variance in companies’ carbon disclosure is evident, largely attributed to different regulatory environments
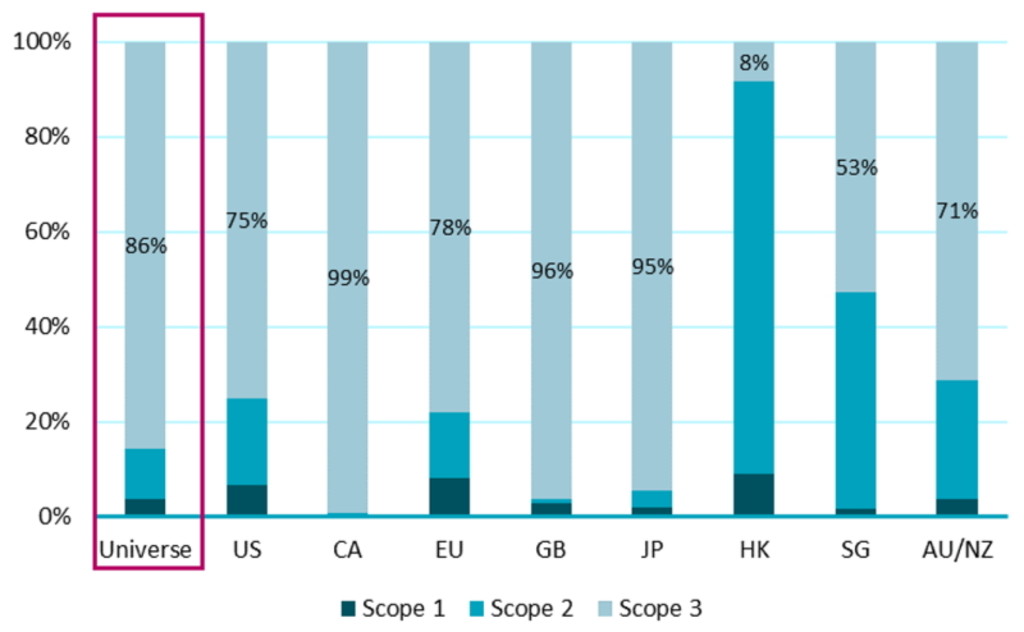
Scope 3 emissions occur along the entire value chain, for example when a building is being used by a lessee. Under the GHG Protocol, Scope 3 emissions are broken down into 15 categories, ranging from upstream emissions including ‘purchased goods and services’, to downstream emissions including leased assets. Among the top 200 largest listed real estate companies, only 56% of them disclosed their Scope 3 emissions in corporate reports, and for those that did, the figures provided are not exhaustive. Scope 3 emissions account for 86% of the overall emissions for companies that have disclosure for all scopes, seven times higher than Scope 1 & 2 (Figure 1). Some geographical variances are notable, with Hong Kong companies reporting only 8% of their emissions coming from Scope 3. This is in reality attributed to data incompleteness rather than the actual emissions.
Figure 1 | Carbon emissions breakdown by scope
Source: Corporate reports, Robeco.
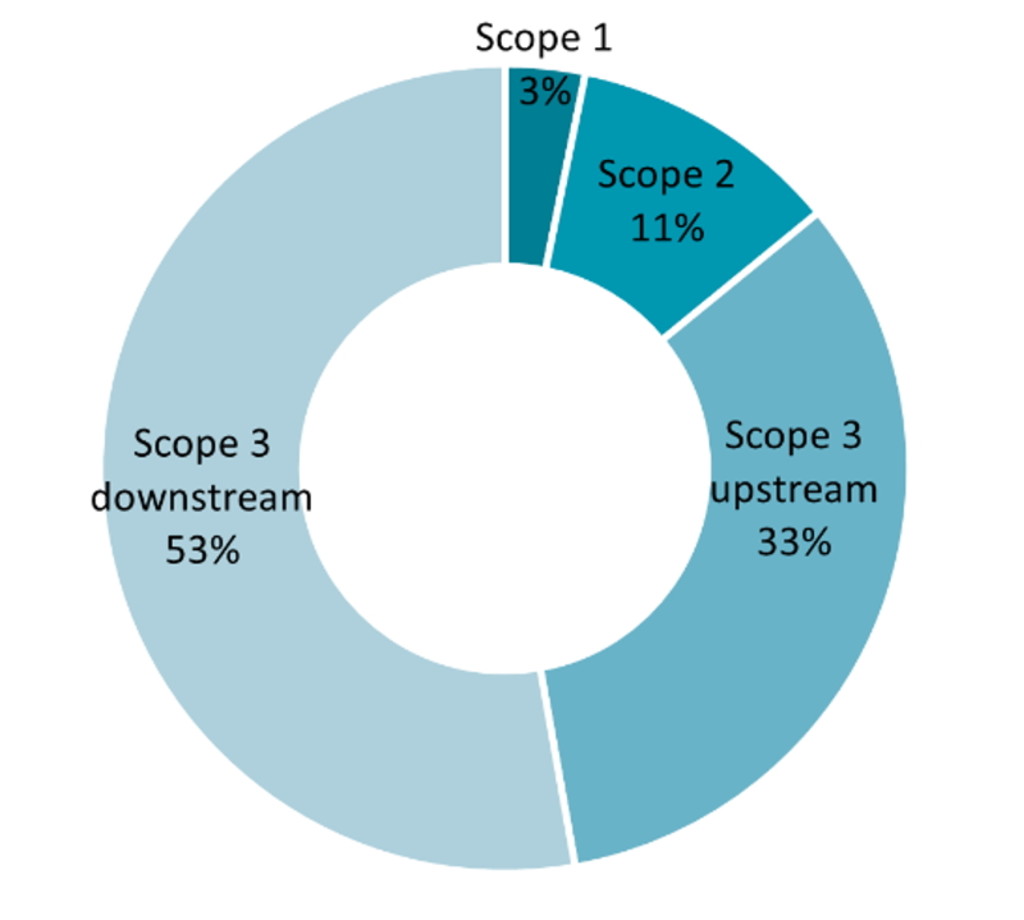
Scope 3 emissions are difficult and expensive to measure due to their indirect nature and the challenge of collecting meaningful data. Figure 2 aggregates carbon emissions for companies in our sample that disclose all Scope 1 & 2, and Scope 3 emissions by category. It illustrates that carbon emissions of real estate companies are dominated by Scope 3 emissions.
了解最新的可持續性市場觀點
訂閱我們的電子報,探索塑造可持續投資的趨勢。
Figure 2 | Carbon emissions breakdown
Source: Corporate reports, Robeco.
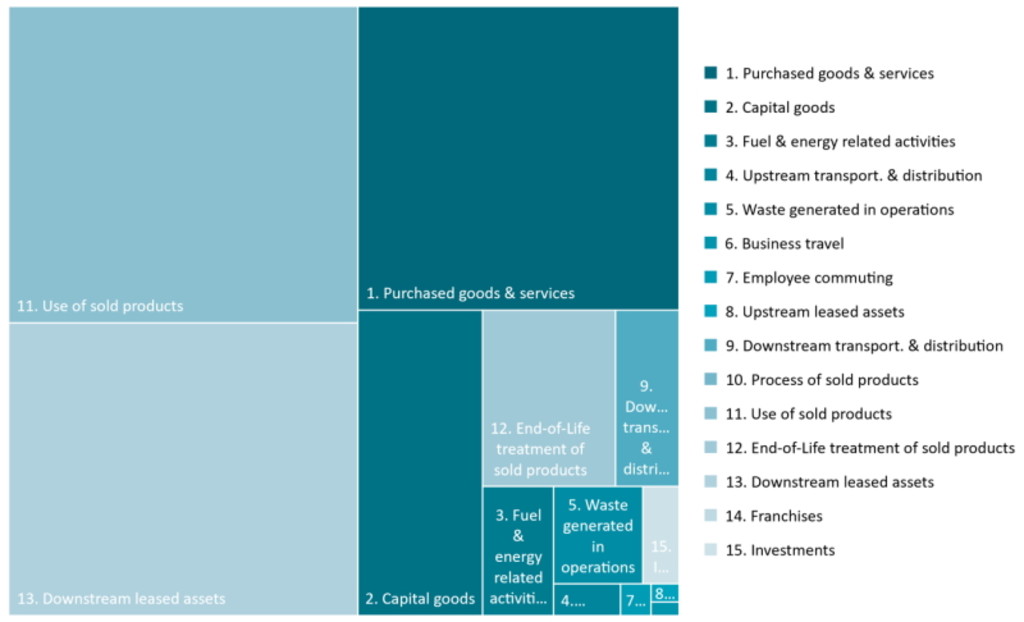
Examining each Scope 3 category, Figure 3 shows that downstream categories such as ‘use of sold products’ and ‘downstream leased assets’ are among the most relevant for real estate companies, each accounting for about a quarter of the aggregated Scope 3 emissions respectively. The upstream category of ‘purchased goods and services’ accounts for another quarter.
Figure 3 | Scope 3 emissions breakdown by category
Source: Corporate reports, Robeco.1
Why do some companies disclose Scope 3 emissions?
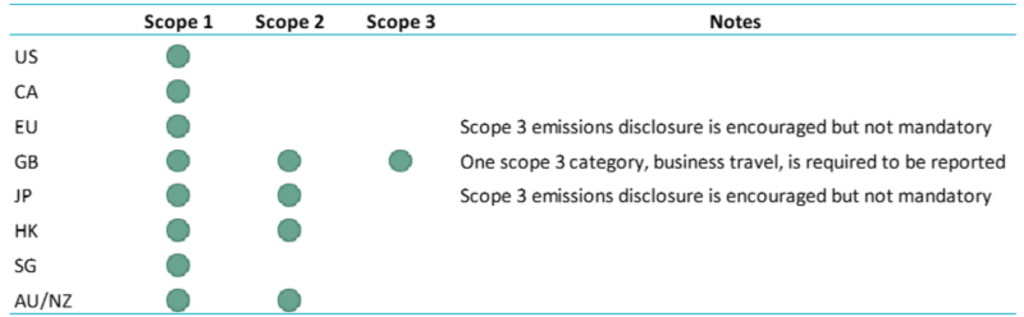
The primary factor we can see is the regulatory framework the company operates under. This one key factor also explains the wide geographical variance in carbon reporting. Within our universe the leaders in Scope 3 emissions reporting include Great Britain (93%), Australia and New Zealand (75%), and the European Union (73%). On the other hand, the United States (41%) and Singapore (42%) exhibit low levels of disclosure. As demonstrated in Figure 4 below, mandatory carbon disclosure schemes vary across the eight geographies. Governments have a variety of potential policy interventions in their toolbox to support the sustainability transition, and mandatory reporting is an effective one.
Source: OECD, Robeco.
Full disclosure is necessary
Although disclosure is not a sufficient condition for decarbonization of the property sector, it is a necessary one. Credible net-zero pledges require complete and accurate accounting and reporting of all scope emissions and all operations along the value chain. Geographical variances show that the UK is leading in this regard with a mandatory carbon reporting scheme covering all scopes. This highlights the key role governments play in ensuring companies comprehensively assess their environmental impact, thereby paving the way towards a net-zero future.
Footnote
1 The data are sourced from companies in Robeco’s data that disclosed Scope 3 emissions by category.
Important information
The contents of this document have not been reviewed by the Securities and Futures Commission ("SFC") in Hong Kong. If you are in any doubt about any of the contents of this document, you should obtain independent professional advice. This document has been distributed by Robeco Hong Kong Limited (‘Robeco’). Robeco is regulated by the SFC in Hong Kong. This document has been prepared on a confidential basis solely for the recipient and is for information purposes only. Any reproduction or distribution of this documentation, in whole or in part, or the disclosure of its contents, without the prior written consent of Robeco, is prohibited. By accepting this documentation, the recipient agrees to the foregoing This document is intended to provide the reader with information on Robeco’s specific capabilities, but does not constitute a recommendation to buy or sell certain securities or investment products. Investment decisions should only be based on the relevant prospectus and on thorough financial, fiscal and legal advice. Please refer to the relevant offering documents for details including the risk factors before making any investment decisions. The contents of this document are based upon sources of information believed to be reliable. This document is not intended for distribution to or use by any person or entity in any jurisdiction or country where such distribution or use would be contrary to local law or regulation. Investment Involves risks. Historical returns are provided for illustrative purposes only and do not necessarily reflect Robeco’s expectations for the future. The value of your investments may fluctuate. Past performance is no indication of current or future performance.