Researcher


• 研究
Academic insights into using machine learning for valuation
Machine learning (ML) mispricing models are designed to detect hidden nonlinearities that are important in predicting the fundamental value of stocks. In a recent academic paper, the authors show that ML-based mispricing models have the potential to outperform corresponding linear regression (LR) models by augmenting stylized valuation approaches such as discounted cashflow models. Thus, it is important to allow for nonlinearities and interactions in fundamental analysis.
概要
- LR and ML models can be used to estimate fair firm values
- ML-based signals fare better in predicting fundamental values
- A combination of different ML signals can even yield better results
Fundamental analysis is an approach that is used to determine the intrinsic or fair value of a firm and forms the basis of evaluating whether the company is undervalued or overvalued. Investors can potentially gain from such assessments if they subscribe to the notion that a company’s share price converges to its fair value over the long run: either by buying undervalued stocks or selling overvalued ones.
According to the academic literature, fundamental analysis is typically based on highly stylized valuation approaches such as discounted cashflow models which require inputs such as cashflow forecasts and discount rates. This approach is complicated by the discretion a researcher has over the choice of variables and parameters of the model.
Although these stylized models are extremely popular, explicit cash flow forecasts and discount rates are not necessarily required for fundamental analysis. For instance, an agnostic approach can estimate the fair value of a company as a linear function of its balance sheet, income statement and cashflow statement items.
To this end, a direct approach for estimating fair values is proposed by Bartram and Grinblatt in two academic studies.1 They “take the view of a statistician with little knowledge of finance” and use LR to proxy the “peer-implied fair value” of a firm as a linear function of 21 commonly reported accounting items. They conclude in their findings that their signal reliably predicts future returns in the US and most regions in the world, with the exception of the European market.
In a recent research paper,2 Hanauer, Kononova and Rapp opt for a different approach as they “take the view of a data scientist with little knowledge of finance”. Inspired by the studies of Bartram and Grinblatt, they apply LR and ML methods to estimate the monthly fair values of stocks from 17 European countries for the period January 1993 to December 2019. Then, based on the results, they assess the return predictability of the corresponding mispricing signals, i.e., the difference in model-based fair values and actual market values.
In their analysis, the researchers determined the fundamental values of stocks using six different approaches based on:
a LR model that closely followed the one set out by Bartram and Grinblatt,
a linear model on the pooled cross section of stocks from the last 48 months that they used for the other approaches (LR pooled),
a model using the least absolute shrinkage and selection operator (LASSO) to the 21 accounting variables,
a random forest model (RF),
a gradient boosting model (GBRT), and
a model that combines the RF and GBRT signals.
More specifically, the researchers used RF and GBRT models given that these can deal with nonlinearities and interactions, handle noisy features well, and do not require subtle tuning as is the case for more complex methods.
ML-based signals are effective in spotting mispricing opportunities
The researchers sorted the stocks into five quintile portfolios based on the various mispricing signals. They observed that all the models reflected large negative (positive) mispricing signals for the first (fifth) quintile portfolios. Interestingly, the LASSO and ML signals were considerably smaller than their LR counterparts due to the nonlinearity of their valuation models and ability to better fit the data.
To assess the efficacy of the models, they calculated the value-weighted and industry-adjusted monthly portfolio returns to study the relationship between the mispricing signals and subsequent monthly returns. As depicted in Figure 1, they saw that the ML approaches generated statistically and economically significant industry-adjusted return spreads, benefiting uniformly from both long and short positions. While the LR and LASSO signal spreads were significant, their economic relevance was substantially weaker, with a higher portion of their returns coming from the short leg.
Figure 1 | ML-based models displayed efficacy in predicting fundamental values
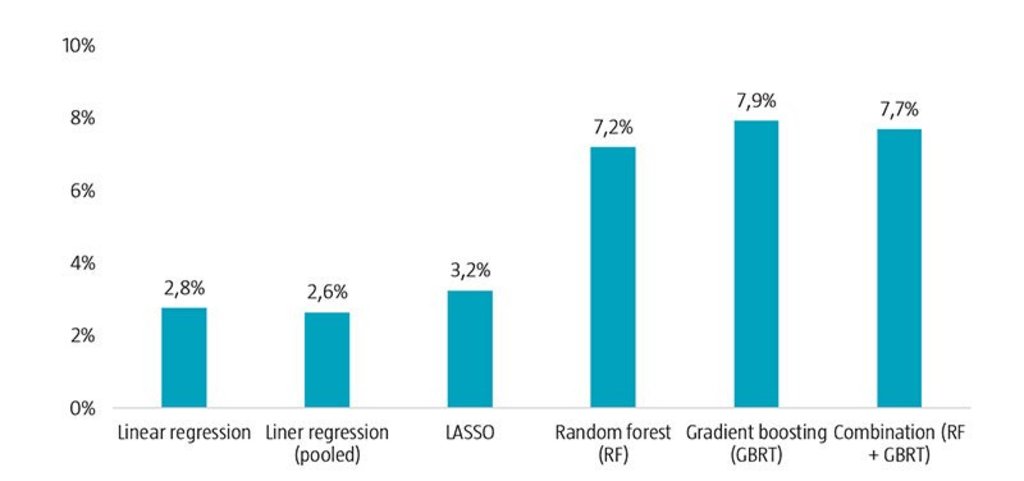
Source: Refinitiv, Robeco. The figure shows the annualized Fama-French six-factor alphas for long minus short quintile portfolio returns based on mispricing signals obtained from different models. The quintile portfolio returns are value-weighted and industry adjusted. The sample period is January 1993 to November 2019.
The researchers also verified the results by taking into account four different factor models. In their tests, they noted that the returns of the LR strategy were largely explained by the common factors. Similarly, the alphas for the LR (pooled) signal decreased. By contrast, the ML models delivered similar or even stronger alphas across all factor models. As such, ML methods seem to detect hidden nonlinearities that are important in predicting the fundamental value of stocks.
Conclusion
ML methods are expected to discover additional structure in data due to their ability to spot nonlinear patterns. Consistent with this view, this analysis shows that the portfolio spreads based on ML mispricing signals can earn large and significant alphas, and outperform corresponding LR mispricing models. These findings suggest that it is important to allow for nonlinearities and interactions in fundamental analysis.
At Robeco, we are convinced that developments in alternative data, artificial intelligence and ML are pivotal to the evolution of investing. We are currently investigating many ML applications that can potentially be of use for quantitative, fundamental and sustainable investing. Importantly, we follow a strict process when testing new variables or methods and stick to our investment philosophy that is based on robust empirical evidence, sound economic rationale and a prudent approach.
Footnotes
1 Bartram, S. M., and Grinblatt, M., April 2018, “Agnostic fundamental analysis works”, Journal of Financial Economics; and Bartram, S. M., and Grinblatt, M., January 2021, “Global market inefficiencies”, Journal of Financial Economics.
2 Hanauer, M. X., Kononova, M., and Rapp, M., April 2022, “Boosting agnostic fundamental analysis: using machine learning to identify mispricing in European stock markets“, Finance Research Letters.
Important information
The contents of this document have not been reviewed by the Securities and Futures Commission ("SFC") in Hong Kong. If you are in any doubt about any of the contents of this document, you should obtain independent professional advice. This document has been distributed by Robeco Hong Kong Limited (‘Robeco’). Robeco is regulated by the SFC in Hong Kong. This document has been prepared on a confidential basis solely for the recipient and is for information purposes only. Any reproduction or distribution of this documentation, in whole or in part, or the disclosure of its contents, without the prior written consent of Robeco, is prohibited. By accepting this documentation, the recipient agrees to the foregoing This document is intended to provide the reader with information on Robeco’s specific capabilities, but does not constitute a recommendation to buy or sell certain securities or investment products. Investment decisions should only be based on the relevant prospectus and on thorough financial, fiscal and legal advice. Please refer to the relevant offering documents for details including the risk factors before making any investment decisions. The contents of this document are based upon sources of information believed to be reliable. This document is not intended for distribution to or use by any person or entity in any jurisdiction or country where such distribution or use would be contrary to local law or regulation. Investment Involves risks. Historical returns are provided for illustrative purposes only and do not necessarily reflect Robeco’s expectations for the future. The value of your investments may fluctuate. Past performance is no indication of current or future performance.