Chief Researcher


• 研究
The quant cycle
Equity factors follow their own sentiment-driven cycle that cannot be explained by traditional business cycle indicators. This implies that factor premiums are a behavioral phenomenon, rather than a reward for macroeconomic risks.
作者



概要
- Business cycle indicators don’t really capture the cyclical variation in equity factor returns
- Equity factors follow their own behavioral cycle: the quant cycle
- The quant cycle can help investors formulate a multi-year outlook
Factors in asset pricing models exhibit cyclical behavior as they offer a premium in the long run while going through bull and bear phases in the short run. In our research, we investigated the possible explanation to these cyclical dynamics, focusing mainly on value, quality, momentum and low-risk factors and an equally-weighted multi-factor portfolio.
From a rational asset-pricing perspective, factor premiums are seen as risk premiums, reflecting rewards for certain macroeconomic risks. This would imply that factor performance is related to the business cycle. But many studies have failed to establish a robust empirical link between the two.1 Indeed, results from our study also illustrated the tenuous nature of this relationship.
In general, what we found was that the multi-factor portfolio had similar returns in contrasting macroeconomic conditions, i.e. expansions versus recessions; inflationary versus non-inflationary; and high ISM purchasing managers’ index (PMI) versus low ISM PMI.
The outcome varied slightly from a single-factor perspective. For example, we observed what we would characterize as strong returns from the momentum factor during inflationary periods, while the low-risk factor struggled, consistent with its known ‘bond-like’ properties.2 Meanwhile, the value and quality factors appeared largely immune to both inflationary and non-inflationary conditions.
We also took into account the Baker and Wurgler investor sentiment index, a popular sentiment indicator in academic literature.3 We established that the returns for the value, quality and low-risk factors were strong when investor sentiment was positive, and weak when investor sentiment was negative. Only the momentum factor appeared to be resilient to the various sentiment states.
Perhaps the difficulty in establishing a relationship between macroeconomic risks and factor premiums lies in the flawed notion that factor premiums are risk premiums. If the source of factor premiums is indeed behavioral, then this would explain why the Baker and Wurgler sentiment index appears to be more effective at distinguishing between high and low factor returns. However, even this indicator is only able to pick up a small portion of the much larger time variation in factor returns.
In our view, the cyclicality in factor returns is driven by sentiment which can best be inferred directly from factor returns. In other words, our premise is that factors essentially follow their own behavioral cycle, and although other macroeconomic and behavioral indicators may pick up some of these dynamics, the full picture can only be uncovered by studying factors themselves.
Mapping out the quant cycle
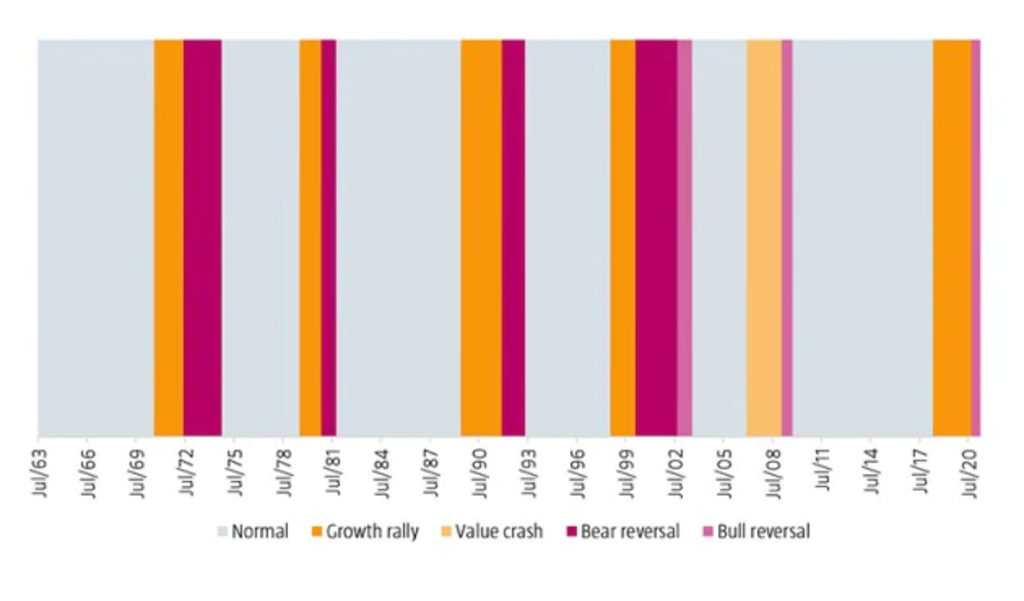
In our study, we determined the quant cycle by qualitatively identifying peaks and troughs that correspond to bull and bear markets in factor returns. Following this approach, we identified a cycle consisting of a normal stage, which prevails about two-thirds of the time, punctuated with occasional large value drawdowns, which tend to be followed by subsequent reversals.
We found that the value drawdowns were caused either by growth rallies or value crashes that occurred roughly once every ten years, typically lasting about two years. These were usually followed by sharp reversals, which were characterized either by a crash of the growth stocks that outperformed strongly in the previous stage, or a strong recovery rally in the stocks that underperformed in the preceding phase. Our historical definition of the quant cycle is depicted in Figure 1.
Figure 1 | The quant cycle, 1963 to 2020
Source: Robeco Quantitative Research
Breaking down the different stages
During the normal stage, we observed that all factors delivered solid positive average returns, typically above their long-term average premiums. Luckily for multi-factor investors, this stage prevailed about two-thirds of the time. However, the relative peace and quiet of the normal period was disturbed by events that unfolded during the remaining one-third.
We witnessed that the growth rallies were characterized by large negative returns for value and large positive returns for momentum. This clearly illustrates how the two factors typically diversify so well with each other during these extreme phases. Low-risk typically took a hit and quality usually performed well in this phase, although not in every instance for both factors. Altogether, the multi-factor approach delivered a roughly flat return on average during growth rallies.
Our sample period only contained one value crash, namely the 2007-2009 global financial crisis. We saw that the factor performance was remarkably similar to the one observed in growth rallies, with negative returns for value and low-risk and positive returns for momentum. Based on this single observation, quality seemingly fared better during value crashes. This resulted in a small positive return for the multi-factor portfolio.
We also picked up two types of reversals: bear and bull. Bear reversals were distinguished by large positive returns for value due to a growth crash. They also tended to be highly favorable for quality, momentum and low-risk. Given that all the factors tended to be effective during these periods, we noticed that the multi-factor mix also delivered strong returns.
By contrast, bull reversals were characterized by large negative returns for momentum due to a rally in stocks with poor momentum. There were also large negative returns for quality and mixed results for value and low-risk. From a multi-factor perspective, we saw that bull reversals presented much tougher challenges than bear reversals.
Using the quant cycle as a framework -07
Thus, we conclude that investors should focus their efforts on better understanding the quant cycle as implied by the factors, rather than adhering to traditional frameworks. We believe this can helpful in contextualizing the cyclical dynamics of factors. It can provide investors with the basis to formulate a multi-year outlook, by providing insight on how the quant cycle could potentially unfold based on the prevalent market environment. The model can also give them a frame of reference to examine the robustness of new alpha factors across the various stages of the cycle.
探索量化價值
訂閱我們的電子報,獲取尖端的量化策略和見解。
FOOTNOTES
1See: Ilmanen, A., Israel, R., Lee, R., Moskowitz, T. J., and Thapar, A., February 2021. “How do factor premia vary over time? A century of evidence.”, Journal of Investment Management (forthcoming).
2See: Blitz, D., September 2020, “The risk-free asset implied by the market: medium-term bonds instead of short-term bills.”, Journal of Portfolio Management 46 (8): 120-132.
3See: Baker, M. and Wurgler, J., August 2006, “Investor sentiment and the cross-section of stock returns.”, Journal of Finance 61 (4): 1645-1680.
重要資料
本網站僅供《證券及期貨條例》(香港法例第571章)及其附屬法例所界定之專業投資者瀏覽及使用。 投資涉及風險。過往表現並不代表未來表現。本網站所載資料僅供參考之用,並不構成任何投資建議,亦非作出買賣任何證券或採納任何投資策略之要約或招攬。投資者不應僅憑本網站提供之資料作出投資決定,在作出任何投資決定前,應徵詢獨立意見(包括有關稅務影響之意見)。投資者應確保完全理解投資產品的相關風險,亦應考量自身投資目標及風險承受水平。投資乃閣下之個人決定。除非銷售投資產品的中介人已向閣下告知該投資產品適合閣下,並已解釋其符合閣下投資目標之原因,否則閣下不應投資。請參閱相關發售文件或其他法律文件,以獲取包括風險因素在內的進一步詳情。 本網站由荷寶投資管理香港有限公司發布,該公司受香港證券及期貨事務監察委員會(「證監會」)規管(中央編號:APU851)。本網站未經證監會審閱。 無法保證任何投資產品可實現其投資目標。概不就任何投資產品之表現或投資回報作任何聲明或承諾。投資的價值或會波動。本網站所載過往表現、推算或預測,均不應視作未來表現之保證或指標,且概不提供任何明示或暗示之保證。本網站內容建基於相信為可靠之來源,惟因應資料傳遞技術特性及須採用多項數據來源(包括第三方內容),故概不保證其準確性。所述觀點僅乃截至上述日期,或會隨市況變化而改變,可予更改而毋須另行通知。該等意見可能有別於其他荷寶投資專業人士之意見。因使用本材料或當中所載任何評論、意見或估算而引致之直接、間接或相應損失,荷寶概不承擔法律責任。荷寶並無責任更新本網站或任何網站內容。未經荷寶事先書面許可,不得複製、分發或刊發本網站任何材料。 除非另有說明,資料來源:荷寶。