
Global Head of Fundamental Equity


• インサイト
Targeting alpha in a global trade revolution
The trade war started by the new US government has prompted a severe stock market sell-off as economic confidence recedes amid uncertainty over the re-organization of complex global supply chains. This paradigm shift in trading conditions requires a more balanced global equity allocation to both developed and emerging markets.
まとめ
- US exceptionalism is in question, even if Trump’s trade war is contained
- Long-term alpha generation will demand a more global footprint
- Rebalancing away from US assets and USD weakness will bolster EM
‘Liberation day’ on 2 April has had two impacts which will be enduring. First, US exceptionalism took a serious blow, with the imposition of sweeping global tariffs certain to drive US inflation, weaken the US economy and make it more difficult for leading US multinationals to operate globally. Second, the impact on the global economy ex-US will be deflationary, with lower demand and overcapacity in some sectors likely to manifest itself rapidly, with negative short-to-medium-term macroeconomic aftershocks.
At the time of President Trump’s inauguration, US equity market dominance had reached its zenith with the US accounting for 64% of the MSCI All World Index while the country accounts for 15.5% of global GDP in 2024.1
Figure 1: MSCI World is dominated by US companies
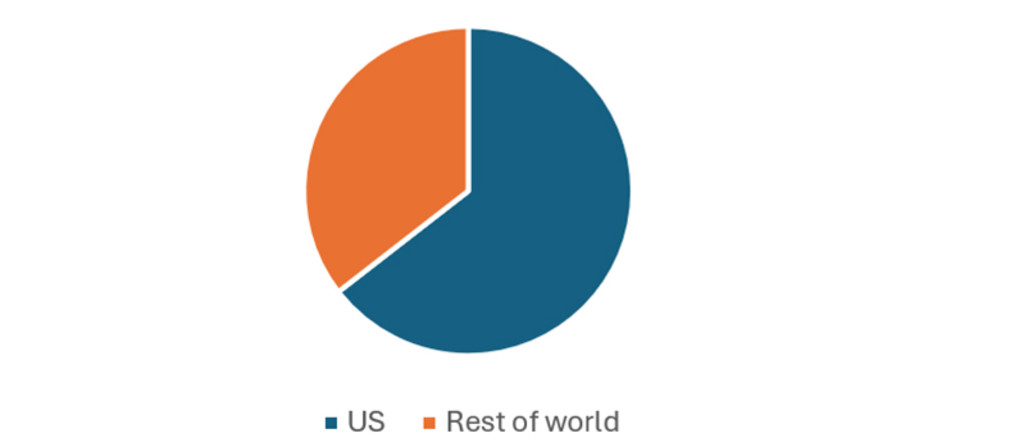
Source: MSCI. The MSCI ACWI captures large- and mid-cap representation across 23 developed markets (DM) and 24 emerging markets (EM) countries. With 2,558 constituents, the index covers approximately 85% of the global investable equity opportunity set.
Valuations also reflected this dominance, with the US CAPE ratio on 31 March 2025 at 32.8, compared to an average of 19 for developed markets (DM) and an average of 14 for emerging markets (EM).2 This US valuation premium seems certain to narrow as the US rewrites the rules of global competition.T
Read the complete insight and get our analysis of where to invest in this new global trading landscape.
Footnotes
1Source: Statista based on a Purchasing Power Parity measure of estimated 2024 GDP.
21Q25 Global Valuations – The Idea Farm - 8 April 2025. The CAPE ratio (cyclically adjusted price-to-earnings ratio), assesses whether the market is overvalued or undervalued by comparing current prices to average earnings over a 10-year period, adjusted for inflation.
最新のインサイトを受け取る
投資に関する最新情報や専門家の分析を盛り込んだニュースレター(英文)を定期的にお届けします。
重要事項
当資料は情報提供を目的として、ロベコ・ジャパン株式会社(以下「当社」)が独自に作成、または当社のグループ会社(Robeco Institutional Asset Management B.V.およびその関連会社を含む)から提供された資料を当社が編集・翻訳したものです。資料中の個別の金融商品の売買の勧誘や推奨等を目的とするものではありません。記載された情報は十分信頼できるものであると考えておりますが、その正確性、完全性を保証するものではありません。意見や見通しはあくまで作成日における弊社の判断に基づくものであり、今後予告なしに変更されることがあります。運用状況、市場動向、意見等は、過去の一時点あるいは過去の一定期間についてのものであり、過去の実績は将来の運用成果を保証または示唆するものではありません。また、記載された投資方針・戦略等は全ての投資家の皆様に適合するとは限りません。当資料は法律、税務、会計面での助言の提供を意図するものではありません。 ご契約に際しては、必要に応じ専門家にご相談の上、最終的なご判断はお客様ご自身でなさるようお願い致します。 運用を行う資産の評価額は、組入有価証券等の価格、金融市場の相場や金利等の変動、及び組入有価証券の発行体の財務状況による信用力等の影響を受けて変動します。また、外貨建資産に投資する場合は為替変動の影響も受けます。運用によって生じた損益は、全て投資家の皆様に帰属します。したがって投資元本や一定の運用成果が保証されているものではなく、投資元本を上回る損失を被ることがあります。弊社が行う金融商品取引業に係る手数料または報酬は、締結される契約の種類や契約資産額により異なるため、当資料において記載せず別途ご提示させて頂く場合があります。具体的な手数料または報酬の金額・計算方法につきましては弊社担当者へお問合せください。 当資料及び記載されている情報、商品に関する権利は弊社に帰属します。したがって、弊社の書面による同意なくしてその全部もしくは一部を複製またはその他の方法で配布することはご遠慮ください。 商号等: ロベコ・ジャパン株式会社 金融商品取引業者 関東財務局長(金商)第2780号 加入協会: 一般社団法人 資産運用業協会