Strategist


• インサイト
The invisible hand that guides bond markets
Understanding the neutral interest rate at which an economy neither contracts nor expands has vexed investors for years. But once grasped, the r* rate can provide many opportunities in bond markets, say Martin van Vliet, Bob Stoutjesdijk, Rikkert Scholten and Philip McNicholas.
執筆者


Strategist


Strategist
まとめ
- Central banks use the r* neutral rate as a guide for setting rates
- R* depends on the interplay between savings supply and demand
- Our r* estimates are below those of the wider market
Policymakers at the European Central Bank (ECB) and US Federal Reserve frequently refer to the neutral rate or r*, confirming that central banks see it as a guide for interest rate policy. Understanding this theoretical concept is crucial not only for grasping cross-market differences in longer-term bond yields and yield curves, but also for identifying investment opportunities. However, because of its theoretical nature, this is a complicated process.
For any given market, r* estimates depend on a host of assumptions encompassing factors such as inflation, growth, fiscal prudence and demographics. Here, we discuss the drivers of r* and its direction of travel and present our own estimates of r* in comparison with market implied proxies.
Our r* estimates are below those of the market. While we agree with the view that an easier post-pandemic fiscal stance may be a factor in halting the secular downtrend in the neutral rate, we believe demographic shifts could keep it low, by historical standards, over the next five to ten years. This is particularly true for advanced economies and is shown in the graphic below.
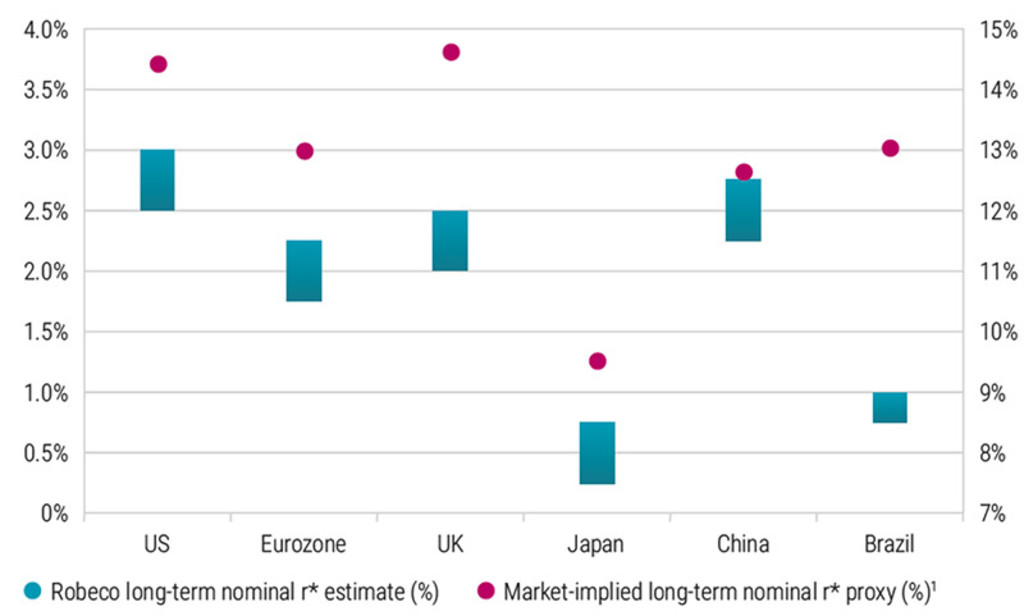
** 5y OIS 5y forward, except for China & Brazil (5y5y sovereign yield)
Robeco long-term nominal r* vs market-implied nominal r*. Source: Bloomberg, Federal Reserve, ECB, BoE, BoJ, BIS.
Many central banks are in the final stage of their tightening cycles, which were initiated to curb inflation. How high policy rates will go depends on incoming macro data, but if central banks succeed in steering inflation back towards their targets, policy rates are likely to reduce over time.
Indeed, this is what financial markets are discounting, and in the long run, after the economy has adjusted to any cyclical fluctuations, policy rates are expected to assume their equilibrium. This is the level at which monetary (interest rate) policy is considered neither accommodative nor contractionary, i.e. it neither stokes nor slows economic growth.
The difficulty for investors is that this long-run equilibrium policy rate, also called the neutral rate, or r*, is an unobservable theoretical construct and therefore must be estimated. Even so, it can – in the words of Bank of England Governor Andrew Bailey – “provide an indication of the general outlook for interest rates over the coming years,” especially because central banks use it as a point of reference. Indeed, ECB policymakers have frequently referenced the neutral rate in speeches over recent quarters, as have US Fed officials, including Chairman Jerome Powell.
R* is often referred to in ‘real’ or inflation-adjusted terms, as consumer and business investment decisions are typically affected by the level of borrowing costs that take into account the inflation expected to prevail during the life of the investment. Converting r* into a nominal variable thus implies adding a measure of inflation expectation.
A good example would be a central bank’s prevailing inflation target. An r* perspective can help to understand cross-market differences in longer-term bond yields and yield curves – and in assessing their future evolution.
Drivers of r* and its direction of travel
Put simply, r* depends on the interplay between the supply of savings and the demand for savings to fund investment. Many studies have documented that, due to an excess of desired savings over investments, r* has been on a secular downtrend since the end of the 1970s, as shown in the chart below.
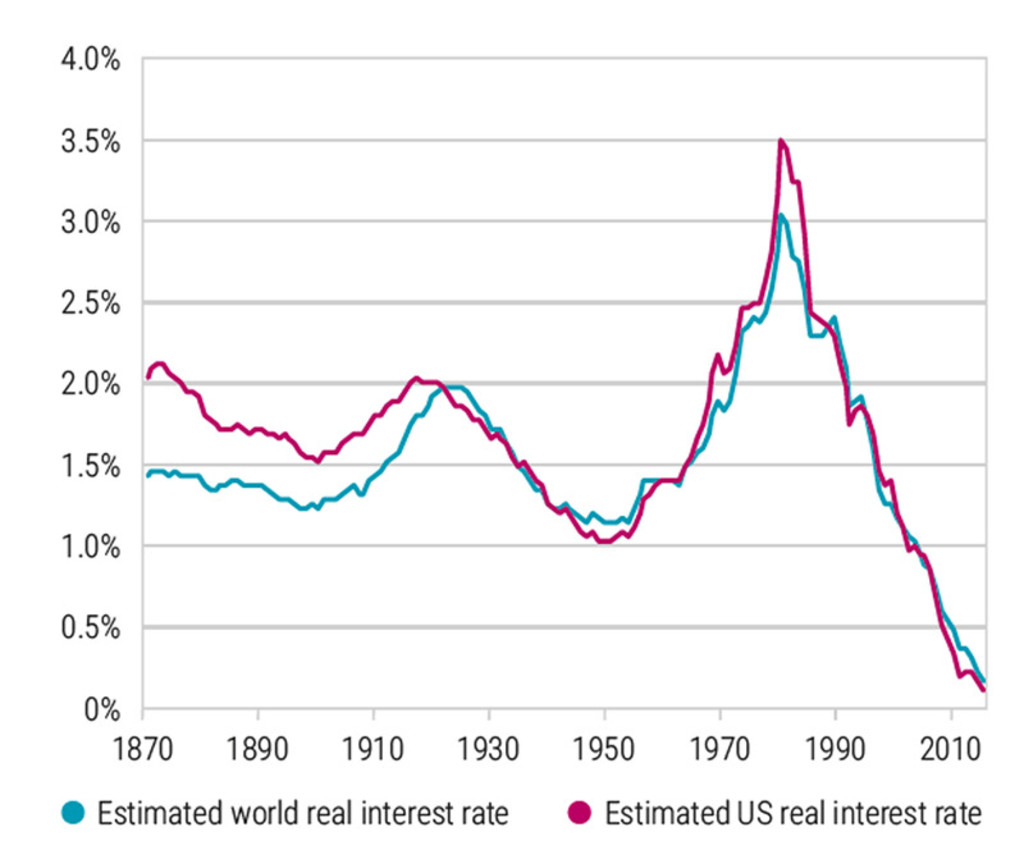
The long-term trend in the world and US real interest rate. Source: Del Negro et al. (2019) 1
A recent study by BoE researchers postulates that, from a global point of view, this decline was predominantly driven by two factors. 2 The first is an increase in longevity that pushed up desired savings of would-be retirees. The second is a slowdown in productivity growth that reduced demand for capital at a given interest rate because of lower potential returns on new investments. Good examples of countries where these two effects are evident are Japan and China.
Meanwhile, research shows that in advanced economies, a decline in population growth and increased inequality have amplified the decline in r*. 3 The latter is believed to have been due to the increased marginal propensity of higher income/wealth cohorts to save. They also estimate that increased government debt since the 1970s has dampened the secular decline in r*.
Such findings are corroborated by other research which shows that elevated sovereign debt supply between 2008 and 2019 has worked to push up the long-run r* in the US, Canada, the UK, and the Eurozone from earlier lows.4 A further rise in government debt since the pandemic may have reinforced this, as also suggested in two recent Fed studies.
This finding contrasts with the view that high and rising government debt tends to push down r* by increasing economic agents’ desire to save out of fear of future tax rises. We do suspect though, that at higher debt levels, financial stability could come under pressure at lower interest rate levels than otherwise would be the case.
最新のインサイトを受け取る
投資に関する最新情報や専門家の分析を盛り込んだニュースレター(英文)を定期的にお届けします。
Emerging markets experience
Studies for emerging market countries confirm the positive relationship between government debt and the level of r*, although here the causation seems to run via the credibility channel of monetary policy. Typically, countries with relatively high levels of government debt and twin deficits (i.e. a fiscal and current account deficit) run the risk of high imported inflation and it is up to the central bank to credibly prevent this.
Fiscal policy loosening will thus require a firm response by the central bank to counterbalance potential inflationary impulses and prevent the current account from weakening further by trying to keep the currency stable. Hence, r* is higher in such economies relative to those with lower government debt and more sound fiscal metrics – for example, with Brazil compared to Germany.
Looking ahead, we concur with the view that a generally looser fiscal regime since the pandemic may have helped break the secular downtrend in r*. One additional consideration, also flagged by the IMF in 2022, is the upward effect on r* from accelerating global investment to address climate change.
Nonetheless, in light of the lingering demographic trends we suspect that r*, certainly in advanced economies and by historical standards, is likely to remain low over the next five to ten years.
Footnotes
1Del Negro et al. (2019) “Global trends in interest rates”, Journal of International Economics, vol. 118, issue C.
2BoE Staff Working Paper, Decomposing the drivers of Global R*, July 2022
3Rachel, L. and L Summers (2019) “On secular stagnation in the industrialized world”, NBER Working Paper 26198
4Eggertsson, G. et al. (2019) “A model of secular stagnation: Theory and Quantitative evaluation”, American Economic Journal: Macroeconomics 2019; Ferreira, T. and C. Davin (2022) “Longer-run neutral rates in major advanced economies”, FEDS Notes
This article is an excerpt of a special topic in our five-year outlook.
Webinar: 5-Year Expected Returns 2024-2028
Our five-year outlook on market opportunities and risks.
重要事項
当資料は情報提供を目的として、ロベコ・ジャパン株式会社(以下「当社」)が独自に作成、または当社のグループ会社(Robeco Institutional Asset Management B.V.およびその関連会社を含む)から提供された資料を当社が編集・翻訳したものです。資料中の個別の金融商品の売買の勧誘や推奨等を目的とするものではありません。記載された情報は十分信頼できるものであると考えておりますが、その正確性、完全性を保証するものではありません。意見や見通しはあくまで作成日における弊社の判断に基づくものであり、今後予告なしに変更されることがあります。運用状況、市場動向、意見等は、過去の一時点あるいは過去の一定期間についてのものであり、過去の実績は将来の運用成果を保証または示唆するものではありません。また、記載された投資方針・戦略等は全ての投資家の皆様に適合するとは限りません。当資料は法律、税務、会計面での助言の提供を意図するものではありません。 ご契約に際しては、必要に応じ専門家にご相談の上、最終的なご判断はお客様ご自身でなさるようお願い致します。 運用を行う資産の評価額は、組入有価証券等の価格、金融市場の相場や金利等の変動、及び組入有価証券の発行体の財務状況による信用力等の影響を受けて変動します。また、外貨建資産に投資する場合は為替変動の影響も受けます。運用によって生じた損益は、全て投資家の皆様に帰属します。したがって投資元本や一定の運用成果が保証されているものではなく、投資元本を上回る損失を被ることがあります。弊社が行う金融商品取引業に係る手数料または報酬は、締結される契約の種類や契約資産額により異なるため、当資料において記載せず別途ご提示させて頂く場合があります。具体的な手数料または報酬の金額・計算方法につきましては弊社担当者へお問合せください。 当資料及び記載されている情報、商品に関する権利は弊社に帰属します。したがって、弊社の書面による同意なくしてその全部もしくは一部を複製またはその他の方法で配布することはご遠慮ください。 商号等: ロベコ・ジャパン株式会社 金融商品取引業者 関東財務局長(金商)第2780号 加入協会: 一般社団法人 資産運用業協会