Global Head of Fundamental Equity


• 市場觀點
Targeting alpha in a global trade revolution
The trade war started by the new US government has prompted a severe stock market sell-off as economic confidence recedes amid uncertainty over the re-organization of complex global supply chains. This paradigm shift in trading conditions requires a more balanced global equity allocation to both developed and emerging markets.
作者

概要
- US exceptionalism is in question, even if Trump’s trade war is contained
- Long-term alpha generation will demand a more global footprint
- Rebalancing away from US assets and USD weakness will bolster EM
‘Liberation day’ on 2 April has had two impacts which will be enduring. First, US exceptionalism took a serious blow, with the imposition of sweeping global tariffs certain to drive US inflation, weaken the US economy and make it more difficult for leading US multinationals to operate globally. Second, the impact on the global economy ex-US will be deflationary, with lower demand and overcapacity in some sectors likely to manifest itself rapidly, with negative short-to-medium-term macroeconomic aftershocks.
At the time of President Trump’s inauguration, US equity market dominance had reached its zenith with the US accounting for 64% of the MSCI All World Index while the country accounts for 15.5% of global GDP in 2024.1
Figure 1: MSCI World is dominated by US companies
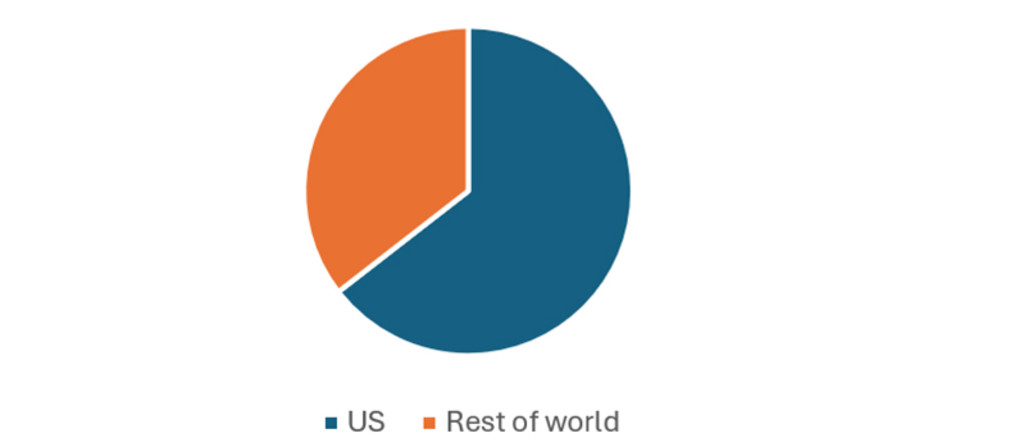
Source: MSCI. The MSCI ACWI captures large- and mid-cap representation across 23 developed markets (DM) and 24 emerging markets (EM) countries. With 2,558 constituents, the index covers approximately 85% of the global investable equity opportunity set.
Valuations also reflected this dominance, with the US CAPE ratio on 31 March 2025 at 32.8, compared to an average of 19 for developed markets (DM) and an average of 14 for emerging markets (EM).2 This US valuation premium seems certain to narrow as the US rewrites the rules of global competition.T
Read the complete insight and get our analysis of where to invest in this new global trading landscape.
Footnotes
1Source: Statista based on a Purchasing Power Parity measure of estimated 2024 GDP.
21Q25 Global Valuations – The Idea Farm - 8 April 2025. The CAPE ratio (cyclically adjusted price-to-earnings ratio), assesses whether the market is overvalued or undervalued by comparing current prices to average earnings over a 10-year period, adjusted for inflation.
獲取最新市場觀點
訂閱我們的電子報,時刻把握投資資訊和專家分析。
重要資料
本網站僅供《證券及期貨條例》(香港法例第571章)及其附屬法例所界定之專業投資者瀏覽及使用。 投資涉及風險。過往表現並不代表未來表現。本網站所載資料僅供參考之用,並不構成任何投資建議,亦非作出買賣任何證券或採納任何投資策略之要約或招攬。投資者不應僅憑本網站提供之資料作出投資決定,在作出任何投資決定前,應徵詢獨立意見(包括有關稅務影響之意見)。投資者應確保完全理解投資產品的相關風險,亦應考量自身投資目標及風險承受水平。投資乃閣下之個人決定。除非銷售投資產品的中介人已向閣下告知該投資產品適合閣下,並已解釋其符合閣下投資目標之原因,否則閣下不應投資。請參閱相關發售文件或其他法律文件,以獲取包括風險因素在內的進一步詳情。 本網站由荷寶投資管理香港有限公司發布,該公司受香港證券及期貨事務監察委員會(「證監會」)規管(中央編號:APU851)。本網站未經證監會審閱。 無法保證任何投資產品可實現其投資目標。概不就任何投資產品之表現或投資回報作任何聲明或承諾。投資的價值或會波動。本網站所載過往表現、推算或預測,均不應視作未來表現之保證或指標,且概不提供任何明示或暗示之保證。本網站內容建基於相信為可靠之來源,惟因應資料傳遞技術特性及須採用多項數據來源(包括第三方內容),故概不保證其準確性。所述觀點僅乃截至上述日期,或會隨市況變化而改變,可予更改而毋須另行通知。該等意見可能有別於其他荷寶投資專業人士之意見。因使用本材料或當中所載任何評論、意見或估算而引致之直接、間接或相應損失,荷寶概不承擔法律責任。荷寶並無責任更新本網站或任何網站內容。未經荷寶事先書面許可,不得複製、分發或刊發本網站任何材料。 除非另有說明,資料來源:荷寶。