Portfolio Manager


• 市場觀點
Bonds are back: Mastering market timing for long-term success
Since 1998, Robeco QI Global Dynamic Duration Strategy has excelled in systematic bond market timing, outperforming in rising-yield periods and offering diversification during risk-off events like 2008. With yields rebounding from 2020 lows, bonds once again provide strong diversification benefits.
作者




Researcher

Researcher
概要
- Strong 27-year live track record of successful bond market timing
- Adding new signals to capture market inefficiencies
- Protection against rising yields and portfolio diversification in risk-off periods
In the (brief) risk-off periods in 2023 and 2024, bonds have rallied when stocks and other risky assets declined. Therefore the strategy can play a valuable role in portfolios with its strong performance in challenging market environments.
We continuously strive to enhance the market-timing strategy. The latest innovation is the addition of duration positions that aim to exploit shorter-term market inefficiencies. These positions should act as a diversifying source of alpha within the existing risk budget while staying true to the nature of the strategy: all active positions are taken in developed government bond markets, based on quantitative strategies.
The flagship of our dynamic duration offering is a global bond strategy, driven primarily by bond market timing through dynamic duration management. The strategy’s duration (interest-rate sensitivity) is increased when our quantitative model has a positive outlook on bond markets, and reduced when the model is negative. The strategy aims to offer protection against rising bond yields and to benefit strongly from declining yields. These active duration positions are implemented using futures in the main developed bond markets: US, Germany and Japan. The global government bond portfolio – on top of which the dynamic duration overlay is applied – is managed with an enhanced index approach, taking sustainability considerations into account. This portfolio is tilted toward government bonds that are deemed attractive based on factors like value, momentum and low-risk. Meanwhile, our portfolio construction algorithm also ensures that, compared to the index, the portfolio’s average ESG rating is better and the average carbon intensity is lower.

Active Quant: finding alpha with confidence
Blending data-driven insights, risk control and quant expertise to pursue reliable returns.
Bonds are back – and so is bond-market volatility
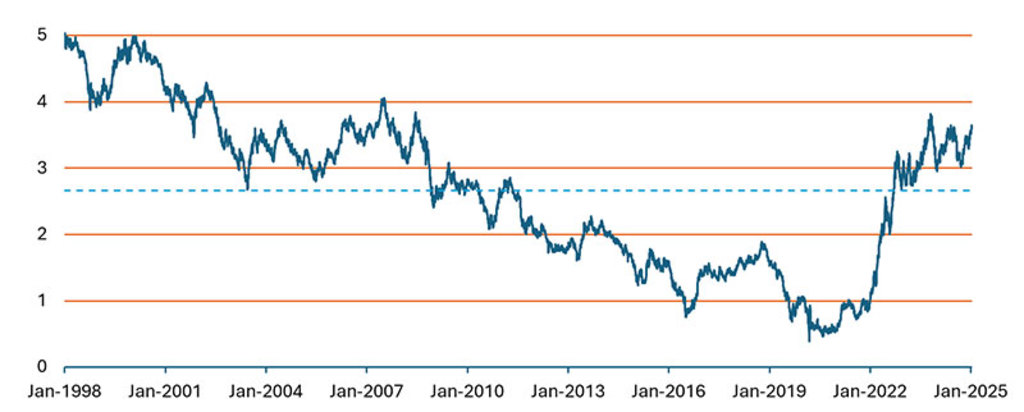
Government bond yields declined in the decade after the financial crisis and reached their lowest levels in 2020 during Covid, with negative yields even on long-dated German bonds. From these levels, further declines in yields and hence further gains for bonds were harder to achieve. But global bond yields have recovered: the yield of the JP Morgan Global Government Bond index is now 1% higher than the average since 1998.
As yields have recovered, bonds have regained the ability to rally strongly when yields decline in response to bad news. This was clear during the US regional banks crisis in spring 2023 and again in summer 2024, when the Nikkei index plunged 12% in a day, and weak US labor market data raised fears of a hard landing. Obviously, yields can also rise further. For example, after the strong rise in yields in 2021-2023, government bonds again lost nearly 3% in the first four months of 2024. And in October, US yields rose ca. 50 bps in a single month. So yes, bonds are back; with yields at better levels, bonds again offer diversification in risk-off periods. But keep in mind, bond volatility is back as well.
Figure 1 - Yield of the global government bond index (unhedged) and average level over 1998-2024
Source: JP Morgan. January 2025
Strong performance when markets move most
The return of bond volatility is actually good news for the Dynamic Duration strategy, as the best opportunities to add value through bond market timing arise when bond yields move significantly. While the live track record of the strategy’s quantitative duration management is already 27 years long, until recently, yields had mainly declined during this period. As we employ a quantitative strategy, we can use backtests and deep historical datasets to look back and analyze what the performance of such a strategy would have been in periods with predominantly rising yields, like the 1970s and early 1980s. That is precisely what we did in our paper published in The Financial Analyst Journal. We showed that the bond market timing strategy is both more profitable and more accurate (a higher success ratio) in calendar quarters with large changes in yields – both upward and downward.
信貸投資的新動態
訂閱我們的電子報,緊跟最新的信貸投資趨勢。
Confirmed in the live track record
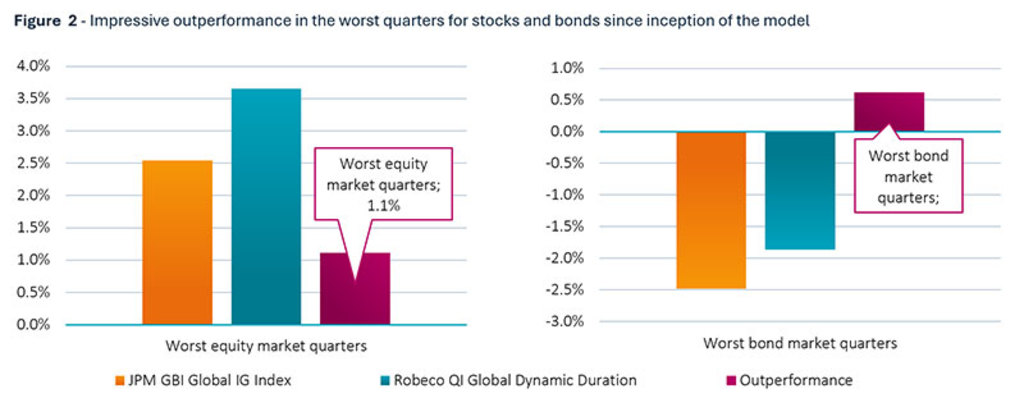
Throughout its live track record, Robeco QI Global Dynamic Duration Strategy has performed in line with the pattern described above: it has, on average, delivered outperformance in the quarters with the weakest bond returns and in the quarters with the weakest equity returns, when bond returns tend to be strong. The average outperformance was in both scenarios clearly stronger than the average outperformance over the full track record. In Figure 2 we show the strategy performance in periods with strongly rising yields and in periods with large equity market declines. The right-hand panel shows the performance in the calendar quarters where the JP Morgan Global Government Bond Index declined more than 1% (now 18 quarters of the 108 quarters since the inception in 19981 ). Government bonds lost an average of 2.5% in these quarters. Robeco QI Global Dynamic Duration Strategy outperformed by 0.6% on average (not annualized!) in these quarters.
On the left-hand side of Figure 2, we focus on the calendar quarters where the MSCI World index declined more than 5%. This happened in 17 out of 108 calendar quarters since 1998. As the graph shows, government bonds on average gained 2.5% in these periods. Robeco QI Global Dynamic Duration’s Strategy average outperformance in these quarters was 1.1% (again not annualized).
Figure 2 - Impressive outperformance in the worst quarters for stocks and bonds since inception of the model
Source: Robeco, Bloomberg. Robeco QI Global Dynamic Duration Strategy. Measurement period 1998-2024. Outperformance refers to average outperformance per quarter over the measurement period and is not annualized. Worst quarters for equities defined as all calendar quarters in the measurement period with a total return for the MSCI World Index of -5% or below (in EUR). Worst quarters for bonds defined as all calendar quarters in the measurement period with a EUR-hedged total return for the JP Morgan Global Government Bond Index of -1% or below. Performance figures gross of fees, based on gross asset value. All figures in EUR. In reality costs (such as management fees and other costs) are charged. These have a negative effect on the returns shown. The value of your investments may fluctuate. Results obtained in the past are no guarantee for the future.
New quant duration signals to exploit market inefficiencies
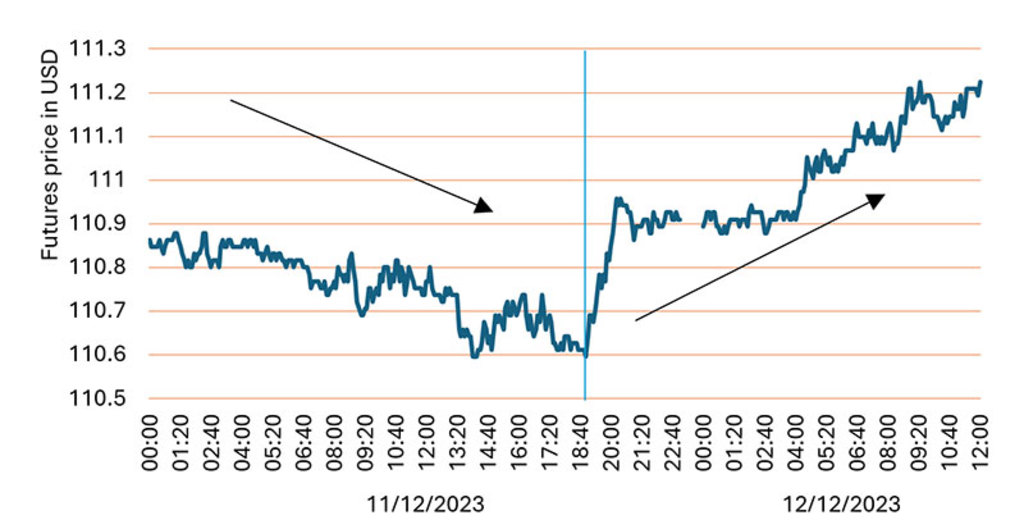
Although our duration-timing research started more than 30 years ago, we keep striving for further enhancements. Our recent research has focused on inefficiencies that result in predictable shorter-term patterns in government bond markets. For example, we observe a V-shaped price pattern around government bond auctions: prices tend to decline in the run-up to the auction and to recover afterward. Figure 3 shows an example of bond futures prices around a US Treasury bond auction, where the vertical line denotes the time of the release of the auction results. As illustrated, the futures price declined before the auction, and recovered immediately after.
We can benefit from this pattern with a short position in government bond futures ahead of the auction, which is then closed and replaced by a long position beforehand. Markets generally absorb the new bond supply quickly, allowing prices to recover and the overweight to be again closed. We thus buy bonds when the Treasury is supplying new bonds to the market, benefiting from the temporarily lower prices. Our research shows how and when to exactly position to efficiently harvest the premium for this liquidity provision, taking risk considerations and transaction costs into account.
Figure 3 - Intraday futures prices (US 10-year bond future) around the December 2023 US 10-year bond auction
Source: Robeco, TickData LLC. Note: Date and time on the horizontal axis have been converted to CET
This auction strategy requires multiple trades within a matter of days. Compared to our regular duration positions, which tend to last for a few weeks to a few months, this is clearly a more short-term strategy. This results in a low correlation with the performance of these regular positions, providing diversification benefits within the strategy. We expect to generate some additional return without materially increasing absolute or relative risk.
The auction strategy is the first shorter-term signal that we have implemented in the dynamic duration strategy. We aim to add more signals in the future, capturing other market inefficiencies. When we do, we will not allow the combined shorter-term signals to take active positions larger than one year of duration. We will not increase the strategy’s tracking error limit; the new signals will be added within the existing risk budget.
Conclusion
Bonds are back: with better yields, they offer diversification in risk-off periods, and bond volatility creates opportunities for Robeco QI Global Dynamic Duration Strategy to add value through market timing. The strategy now includes new duration signals to capture short-term inefficiencies, adding a diversifying alpha source while focusing on developed government bond markets. This innovation builds on 27 years of strong performance. Both our academic research and live track record show that the strategy delivers the most value in challenging market environments, such as the recent multi-year period of sharply rising yields.
Footnote
1January 1998 marks the start of the track record generated based on the current investment strategy in which the active duration positions are based on the quantitative model.
重要資料
本網站僅供《證券及期貨條例》(香港法例第571章)及其附屬法例所界定之專業投資者瀏覽及使用。 投資涉及風險。過往表現並不代表未來表現。本網站所載資料僅供參考之用,並不構成任何投資建議,亦非作出買賣任何證券或採納任何投資策略之要約或招攬。投資者不應僅憑本網站提供之資料作出投資決定,在作出任何投資決定前,應徵詢獨立意見(包括有關稅務影響之意見)。投資者應確保完全理解投資產品的相關風險,亦應考量自身投資目標及風險承受水平。投資乃閣下之個人決定。除非銷售投資產品的中介人已向閣下告知該投資產品適合閣下,並已解釋其符合閣下投資目標之原因,否則閣下不應投資。請參閱相關發售文件或其他法律文件,以獲取包括風險因素在內的進一步詳情。 本網站由荷寶投資管理香港有限公司發布,該公司受香港證券及期貨事務監察委員會(「證監會」)規管(中央編號:APU851)。本網站未經證監會審閱。 無法保證任何投資產品可實現其投資目標。概不就任何投資產品之表現或投資回報作任何聲明或承諾。投資的價值或會波動。本網站所載過往表現、推算或預測,均不應視作未來表現之保證或指標,且概不提供任何明示或暗示之保證。本網站內容建基於相信為可靠之來源,惟因應資料傳遞技術特性及須採用多項數據來源(包括第三方內容),故概不保證其準確性。所述觀點僅乃截至上述日期,或會隨市況變化而改變,可予更改而毋須另行通知。該等意見可能有別於其他荷寶投資專業人士之意見。因使用本材料或當中所載任何評論、意見或估算而引致之直接、間接或相應損失,荷寶概不承擔法律責任。荷寶並無責任更新本網站或任何網站內容。未經荷寶事先書面許可,不得複製、分發或刊發本網站任何材料。 除非另有說明,資料來源:荷寶。