Portfolio Manager
• 市場觀點
Japanification of China?
Could Japan’s three decades of deflation and stagnation since 1990 be echoed by a similar economic funk in China? Robeco’s Asia expert and portfolio manager Arnout van Rijn explains why the China experience can be different.
作者



概要
- Property market woes serious, but not forcing corporate deleveraging
- China’s growth potential is greater than Japan’s was in the 1990s
- Chinese corporate sector has more focus on RoE than Japan used to
Japan’s economy in the late 1980s was characterized by rapid growth and high levels of investment and the country reached a weight of 40% in the MSCI World Index before the bubble burst. It then took the Nikkei 225 nearly 35 years to surpass its December 1989 high. The bursting of the asset price bubble brought about economic stagnation and deflation. Land prices bottomed out only in 2005 and the Japanese stock market didn’t even hit rock bottom until 2012.
Is history repeating itself in China now? Some parallels are becoming increasingly apparent. In 2017, China was projected to become nearly 50% of the global emerging markets benchmark as more and more of the vibrant A-share market became accessible to foreign investors. The market lost its mojo though after the government clamped down on the all too powerful position of the internet giants. China now has ‘just’ a 24% weight in the MSCI Emerging Markets Index.
Can China regain its momentum or will it go the way of Japan with a lost generation for the economy and investors? Are we now seeing a Japanification of China?
In 1980s Japan, companies used property and land to lever up and buy more commercial property or expand into other economically unviable projects. When the bubble collapsed, the corporates and the banks carried the weight of the downturn. In contrast the problems In China are in residential property, not in commercial. Many Chinese families own several properties as an investment or retirement nest egg, hoping for capital gains.
China was already aware of the risks of this activity and acted to avoid a bubble developing. Hence, prices never went up as much as during the land speculation frenzy in Japan in the 1980s. Average residential sales prices per square meter rose 7.3% annually since 2007, well below the increase in annual nominal GDP of about 12% over that same period. In Tokyo, home prices grew 13% annually, well above nominal GDP growth of about 8% in the 1980s.
Figure 1: China home prices: Never really bubbly

Source: CEIC, National Bureau of Statistics, Nomura Research Institute.
Demographics, debt, and deflation
Japan’s population peaked twenty years after the bubble burst in 2010 at 128 million and stood at 123 million in 2023. In comparison, China’s population peaked in 2021 at 1.42 billion and has shrunk slowly since then. The demographic challenge could keep the housing market subdued, as demand is likely to recede. Subsequent deflation increases the real value of debt, necessitating policy to create inflation to keep this manageable. If there ever was a time for easy monetary policy in China, it is now. Japan is generally seen as having erred in keeping monetary policy tight for too long during the early 1990s.
China has a better starting position to deal with leverage and excess capacity than Japan had, since it has more of a growth runway ahead than Japan did in the 1990s. According to IMF data, per capita income in Japan at the end of its economic miracle was 120% that of the US, while in China it stands at 16% now. Economic growth at about 5%, driven by productivity gains, means China can grow out of its problems more easily. A caveat here would be that policy-making in China is deemed to have become less pragmatic and more dogmatic which may result in suboptimal decisions.
CNY is not undervalued
US politicians claim the yuan is cheap today, but real effective exchange rate calculations show it is actually a little expensive. Even at today’s rate, the country is super-competitive and generates a trade surplus of about USD 1 trillion annually. China will not have to fight imported deflation from a rising currency. Its interest will be best served by currency stability and the yuan is unlikely to move a lot over the next five years.
ROE and equities
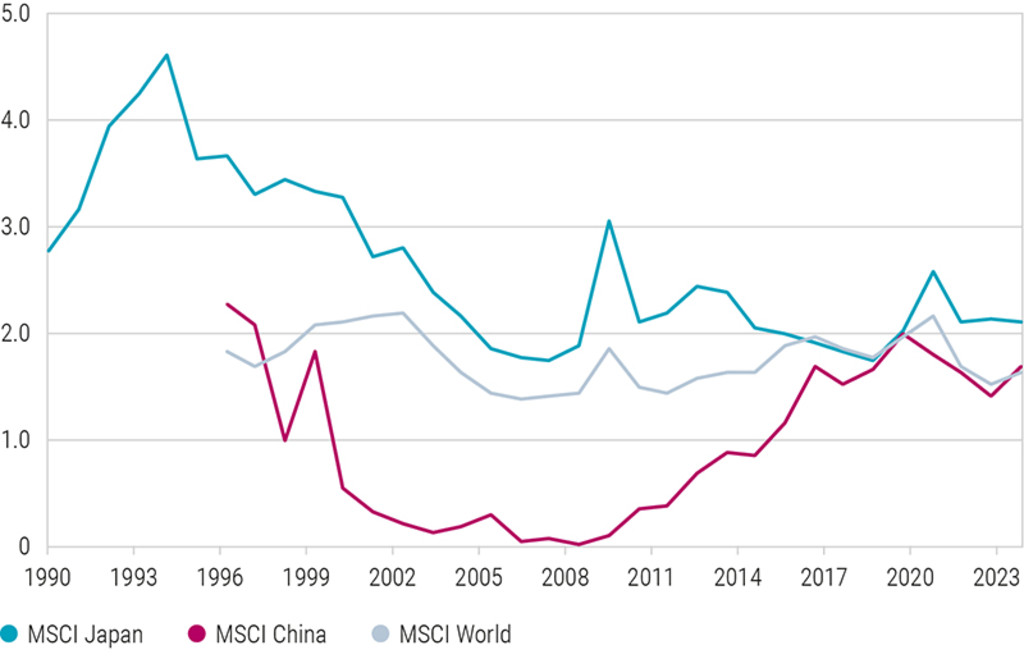
For long-term equity investors, return on equity (RoE) is a crucial yardstick. Considering Chinese companies’ balance sheets probably won’t be affected by the fall in property prices, they are not expected to deleverage like Japan’s corporate sector did in the 1990s. There is a risk though that many industrial companies have overinvested and will need to deal with lower margins and potential write-downs of obsolete factories in the next five years. This could cause Chinese RoE to fall, causing lackluster equity market performance. However, the gearing of Chinese corporates is average by international standards and balance sheets do not need repair via equity issuance. Many private companies have announced buybacks in response to the weakness in share prices: clear capitalist behavior that equity investors will appreciate.
Figure 2: Better RoEs in China than in Japan

Source: MSCI, Morgan Stanley research.
獲取最新市場觀點
訂閱我們的電子報,時刻把握投資資訊和專家分析。
Figure 3: China vs Japan net debt/EBITDA (ex-financials)
Source: MSCI, Morgan Stanley research.
Conclusion
There are three main reasons to assume China will not face the ordeal that Japan lived through. First, Chinese policy makers have been able to contain property price increases to a more manageable level. There is far less leverage in the China property market than there was in Japan.
Second, China can still grow its way out of the problem as there is plenty of room for productivity gains. Third, Chinese corporates so far seem to better understand the cost of equity and also have not been shell-shocked into a rapid de-leveraging cycle.
Chinese companies must now demonstrate they can sustain RoE in the face of overcapacity. If they can, the equity market is undervalued. Conversely, Japanese RoE is on a decisive uptrend, and if they can reach the old Chinese levels, the equity market outlook for Japan will also be bright.
This article is an excerpt of a special topic in our five-year outlook.
重要資料
本網站僅供《證券及期貨條例》(香港法例第571章)及其附屬法例所界定之專業投資者瀏覽及使用。 投資涉及風險。過往表現並不代表未來表現。本網站所載資料僅供參考之用,並不構成任何投資建議,亦非作出買賣任何證券或採納任何投資策略之要約或招攬。投資者不應僅憑本網站提供之資料作出投資決定,在作出任何投資決定前,應徵詢獨立意見(包括有關稅務影響之意見)。投資者應確保完全理解投資產品的相關風險,亦應考量自身投資目標及風險承受水平。投資乃閣下之個人決定。除非銷售投資產品的中介人已向閣下告知該投資產品適合閣下,並已解釋其符合閣下投資目標之原因,否則閣下不應投資。請參閱相關發售文件或其他法律文件,以獲取包括風險因素在內的進一步詳情。 本網站由荷寶投資管理香港有限公司發布,該公司受香港證券及期貨事務監察委員會(「證監會」)規管(中央編號:APU851)。本網站未經證監會審閱。 無法保證任何投資產品可實現其投資目標。概不就任何投資產品之表現或投資回報作任何聲明或承諾。投資的價值或會波動。本網站所載過往表現、推算或預測,均不應視作未來表現之保證或指標,且概不提供任何明示或暗示之保證。本網站內容建基於相信為可靠之來源,惟因應資料傳遞技術特性及須採用多項數據來源(包括第三方內容),故概不保證其準確性。所述觀點僅乃截至上述日期,或會隨市況變化而改變,可予更改而毋須另行通知。該等意見可能有別於其他荷寶投資專業人士之意見。因使用本材料或當中所載任何評論、意見或估算而引致之直接、間接或相應損失,荷寶概不承擔法律責任。荷寶並無責任更新本網站或任何網站內容。未經荷寶事先書面許可,不得複製、分發或刊發本網站任何材料。 除非另有說明,資料來源:荷寶。