


Strategist


• 市場觀點
Bursting or buzzing bubbles?
The magnificent outperformance and stratospheric valuations of a few Big Tech stocks have many investors worried about an investment bubble. Laurens Swinkels and Peter van der Welle analyze a century’s worth of market cycles and find bubbles behave differently, and they are not always bad.

概要
- Magnificent Seven and Big Tech outperformance is raising bubble worries
- Historically, around half of bubbles have not burst
- Though downside risk is elevated, a crash is unlikely
In financial markets, bursting bubbles are frequently characterized by irrational exuberance, where investors drastically overestimate future earnings growth or simply buy assets due to a fear of missing out. Classic bubbles see a spectacular rise in valuations and asset prices only to ‘burst’ as fundamentals catch up to the speculative hype and prices plummet.
In contrast to conventional thinking, Swinkels and van der Welle argue that some bubbles can be entirely rational, especially when investors rightly anticipate the extraordinary growth of a paradigm-shifting technology in the real economy.1 They call these ‘buzzing bubbles’ because their strong price increases and high valuations are largely justified.
Buzzing bubbles are characterized by strong price increases and high valuations that are largely justified
Since AI took center stage in early 2023, the Magnificent Seven2 have outperformed the S&P 500 by around 80%. Rocketing prices and valuations are understandably stoking concerns of a tech equity bubble. Are concerns warranted and if so, should investors be bracing for a spectacular burst or a beneficial buzz?
Figure 1: Performance of the Magnificent Seven versus the rest of the US market
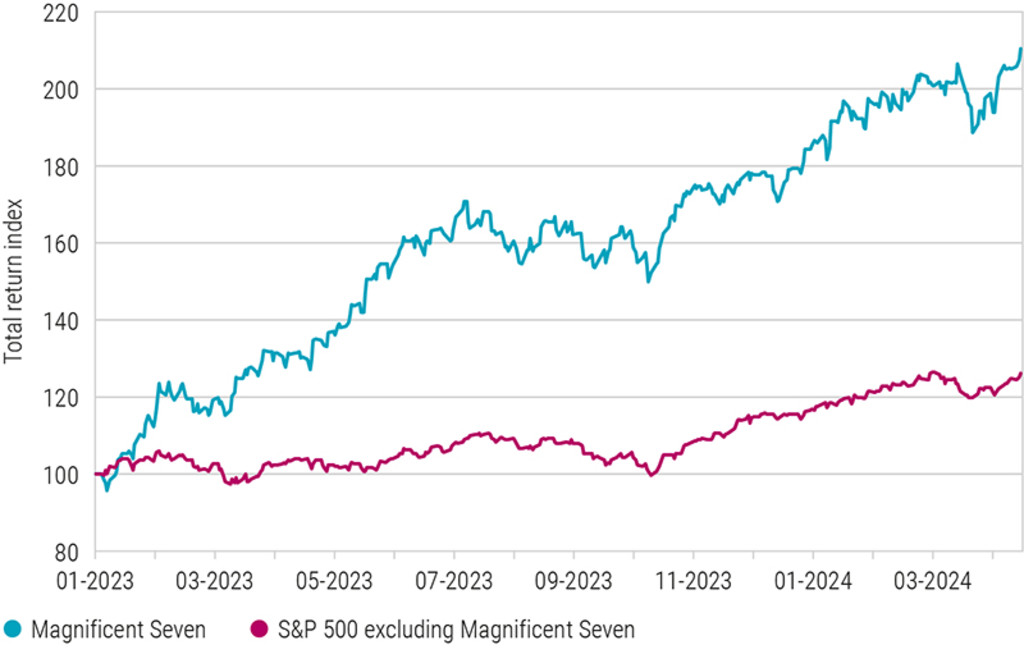
Source: Robeco, LSEG Datastream, S&P 500.
Rebased price index of Magnificent Seven and the S&P 500 index excluding the Magnificent Seven.
Bubbles often begin with an overly optimistic sentiment that a new era has begun and that the old rules no longer apply. Recall the low interest rate environment of the Great Financial Crisis of 2008 or the dot-com boom of the nineties. Whatever the initial cause, they tend to follow the same pattern: valuations and stock prices rise as early entrants generate large profits. Higher valuations lure more competitors. Investor sentiment and capital flows surge, fueling a self-perpetuating loop. Even informed investors can get caught in the mayhem, abandoning better judgement to follow popular wisdom in the hopes that a bubble has further to run.
This crazed phase is followed by a ‘Minsky moment’.3 Animal spirits are replaced with the collective realization that the rally is overextended and that stocks are massively overvalued. Panic begins sending fearful investors stampeding toward the exit. The market crashes and asset prices correct. Cyclical stagnation ensues and investors are left despondent and calling for more regulation.
By now, most investors agree that bubbles are bad. But the authors challenge that notion showing not every bubble is created equal. Although crashes are preceded by price run-ups and expensive valuations, it would be a mistake to take this evidence and conclude that most price run-ups lead to crashes.
It would be a mistake to take this evidence and conclude that most price run-ups lead to crashes
獲取最新市場觀點
訂閱我們的電子報,時刻把握投資資訊和專家分析。
Some bubbles burst others buzz
Building on previous academic research and nearly a century’s worth of US stock data spanning 49 industries, the authors identified 51 industry bubbles in US equity markets from (see Figure 2, blue line).4
Studying their aftermaths, only half of these ended in a burst – defined as a drawdown in returns of more than 40% in the two years following an industry’s stock-price run (Figure 2, magenta line). Examples include utilities (1929), gold (1980), software (1999), and steel (2007). Buzzing bubbles on the other hand, experienced a similar two-year run up in prices but saw no subsequent price drawdown in the two-years following. In fact, returns continued to rise (Figure 2, green line).
Initially, there is little to distinguish between bursting and buzzing bubbles as they expand. However, things get interesting at month nine, where bubble behavior diverges. Bursting bubbles begin to lose a bit of steam, ultimately ending with negative return of about 30% in the two-years following. Returns of buzzing bubbles continue upwards gaining an additional 50% positive return.
Figure 2: Bubbles exhibit different behavior
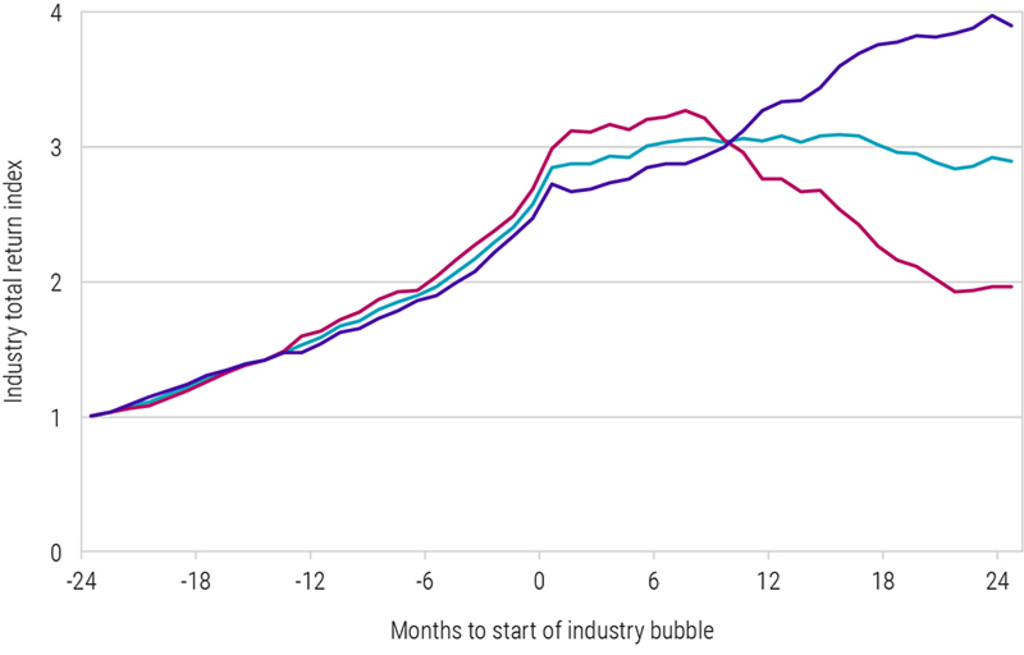
Source: Robeco, Kenneth French Data Library, Greenwood, Shleifer, and You (2019).
The graphic displays industry price run-ups and subsequent performance from US industries from 1926-2024. The blue line indicates the average rebased price index of 51 detected industry-wide bubbles. Of these 23 saw a maximum drawdown of at least 40% (magenta) in the two years that followed, and 28 that did not experience such drawdown (purple).
Other bubbling indicators
While interesting and to some extent comforting to know not all bubbles end badly, investors still need more surrounding indicators to help define what kind we may be approaching. The run-up data from Figure 2 sheds a bit more light, revealing that industry price bubbles that burst tend to have stronger price run-ups compared to buzzing varieties (200% versus 160%).
Moreover, investor optimism is also much higher with bursts than buzzes (77% vs 53% of the median value) coinciding with high market-wide valuations.5 And while valuations are expensive at the start of any bubble compared to the general market average (22.5 vs 18.8), they are even higher for bursts compared to buzzes (23.5 vs 21.6).6
In the absence of bubbles, the probability of a 40% drawdown for an industry within a two-year period is about 13%, but that probability more than triples (45%) when a bubble starts.
So while bubbles can’t be used to precisely predict future returns, they do predict higher equity risks!
Should investors brace for a burst or expect a buzz?
So, are we in a rational or irrational bubble? Ultimately, while there are definitely signs that we are currently in a bubble with an increased risk of a sell-off in the medium term, it is by no means a certainty that we are in a bursting bubble when it comes to technology stocks.
The average two-year run-up return of bursting bubbles is close to 200%, far higher than we have observed today (around 80%). And while the US tech sector is expensive, it’s not exceptionally so based on historical figures. Likewise, overall market sentiment is high (60%), but once again not exceptionally so. Sentiment was far larger during bust periods (77%). News flows specific to technology stocks are substantially above the market average, but not more than usual.
So what should investors do given the circumstances?
One way to keep broad equity market exposure but reduce the probability and severity of a drawdown is to allocate to low-risk assets, preferably those with good momentum, high quality, and attractive valuations. This may come at the cost of missing out on a bubble that keeps on buzzing but will likely reduce the pain in case of a correction.
This article is an excerpt of a special topic in our five-year outlook.
Footnotes
1The history of financial bubbles is described in more detail in: O’Hara (2008), Goetzmann (2016), Engsted (2016), and Quinn and Turner (2023).
2Apple, Amazon, Alphabet, Microsoft, Meta Platforms, Nvidia, and Tesla
3Named for American economist Hyman Minsky, whose research characterized stages of credit cycles and how they lead to financial crises.
4Following the Greenwood, Shleifer, and You (2019) definition of bubbles: a price that has gone up by 100% and has had an outperformance relative to the broader stock market index of 100%, both over the past two years.
5Source for the NYT sentiment index: https://www.hakholm.com/nyt-sentiment-index
6Valuations are calculated using cyclically adjusted price/earnings (CAPE) ratios.
重要資料
本網站僅供《證券及期貨條例》(香港法例第571章)及其附屬法例所界定之專業投資者瀏覽及使用。 投資涉及風險。過往表現並不代表未來表現。本網站所載資料僅供參考之用,並不構成任何投資建議,亦非作出買賣任何證券或採納任何投資策略之要約或招攬。投資者不應僅憑本網站提供之資料作出投資決定,在作出任何投資決定前,應徵詢獨立意見(包括有關稅務影響之意見)。投資者應確保完全理解投資產品的相關風險,亦應考量自身投資目標及風險承受水平。投資乃閣下之個人決定。除非銷售投資產品的中介人已向閣下告知該投資產品適合閣下,並已解釋其符合閣下投資目標之原因,否則閣下不應投資。請參閱相關發售文件或其他法律文件,以獲取包括風險因素在內的進一步詳情。 本網站由荷寶投資管理香港有限公司發布,該公司受香港證券及期貨事務監察委員會(「證監會」)規管(中央編號:APU851)。本網站未經證監會審閱。 無法保證任何投資產品可實現其投資目標。概不就任何投資產品之表現或投資回報作任何聲明或承諾。投資的價值或會波動。本網站所載過往表現、推算或預測,均不應視作未來表現之保證或指標,且概不提供任何明示或暗示之保證。本網站內容建基於相信為可靠之來源,惟因應資料傳遞技術特性及須採用多項數據來源(包括第三方內容),故概不保證其準確性。所述觀點僅乃截至上述日期,或會隨市況變化而改變,可予更改而毋須另行通知。該等意見可能有別於其他荷寶投資專業人士之意見。因使用本材料或當中所載任何評論、意見或估算而引致之直接、間接或相應損失,荷寶概不承擔法律責任。荷寶並無責任更新本網站或任何網站內容。未經荷寶事先書面許可,不得複製、分發或刊發本網站任何材料。 除非另有說明,資料來源:荷寶。