Analyst
• 市場觀點
A decarbonization model that concretely values transition risk for cement
Cement is a critical ingredient for concrete – the most used material in the world behind water. However, cement production is emissions heavy, leaving the industry and its investors exposed to transition risks. Robeco’s proprietary decarbonization model concretely quantifies that risk and provides an early signal for cement’s transition-ready leaders.
作者


Sector Lead
概要
- Cement is critical for buildings and infrastructure construction
- Production is emissions heavy, intensifying transition risk for cement makers
- Decarbonization models quantify transition risks for cement companies
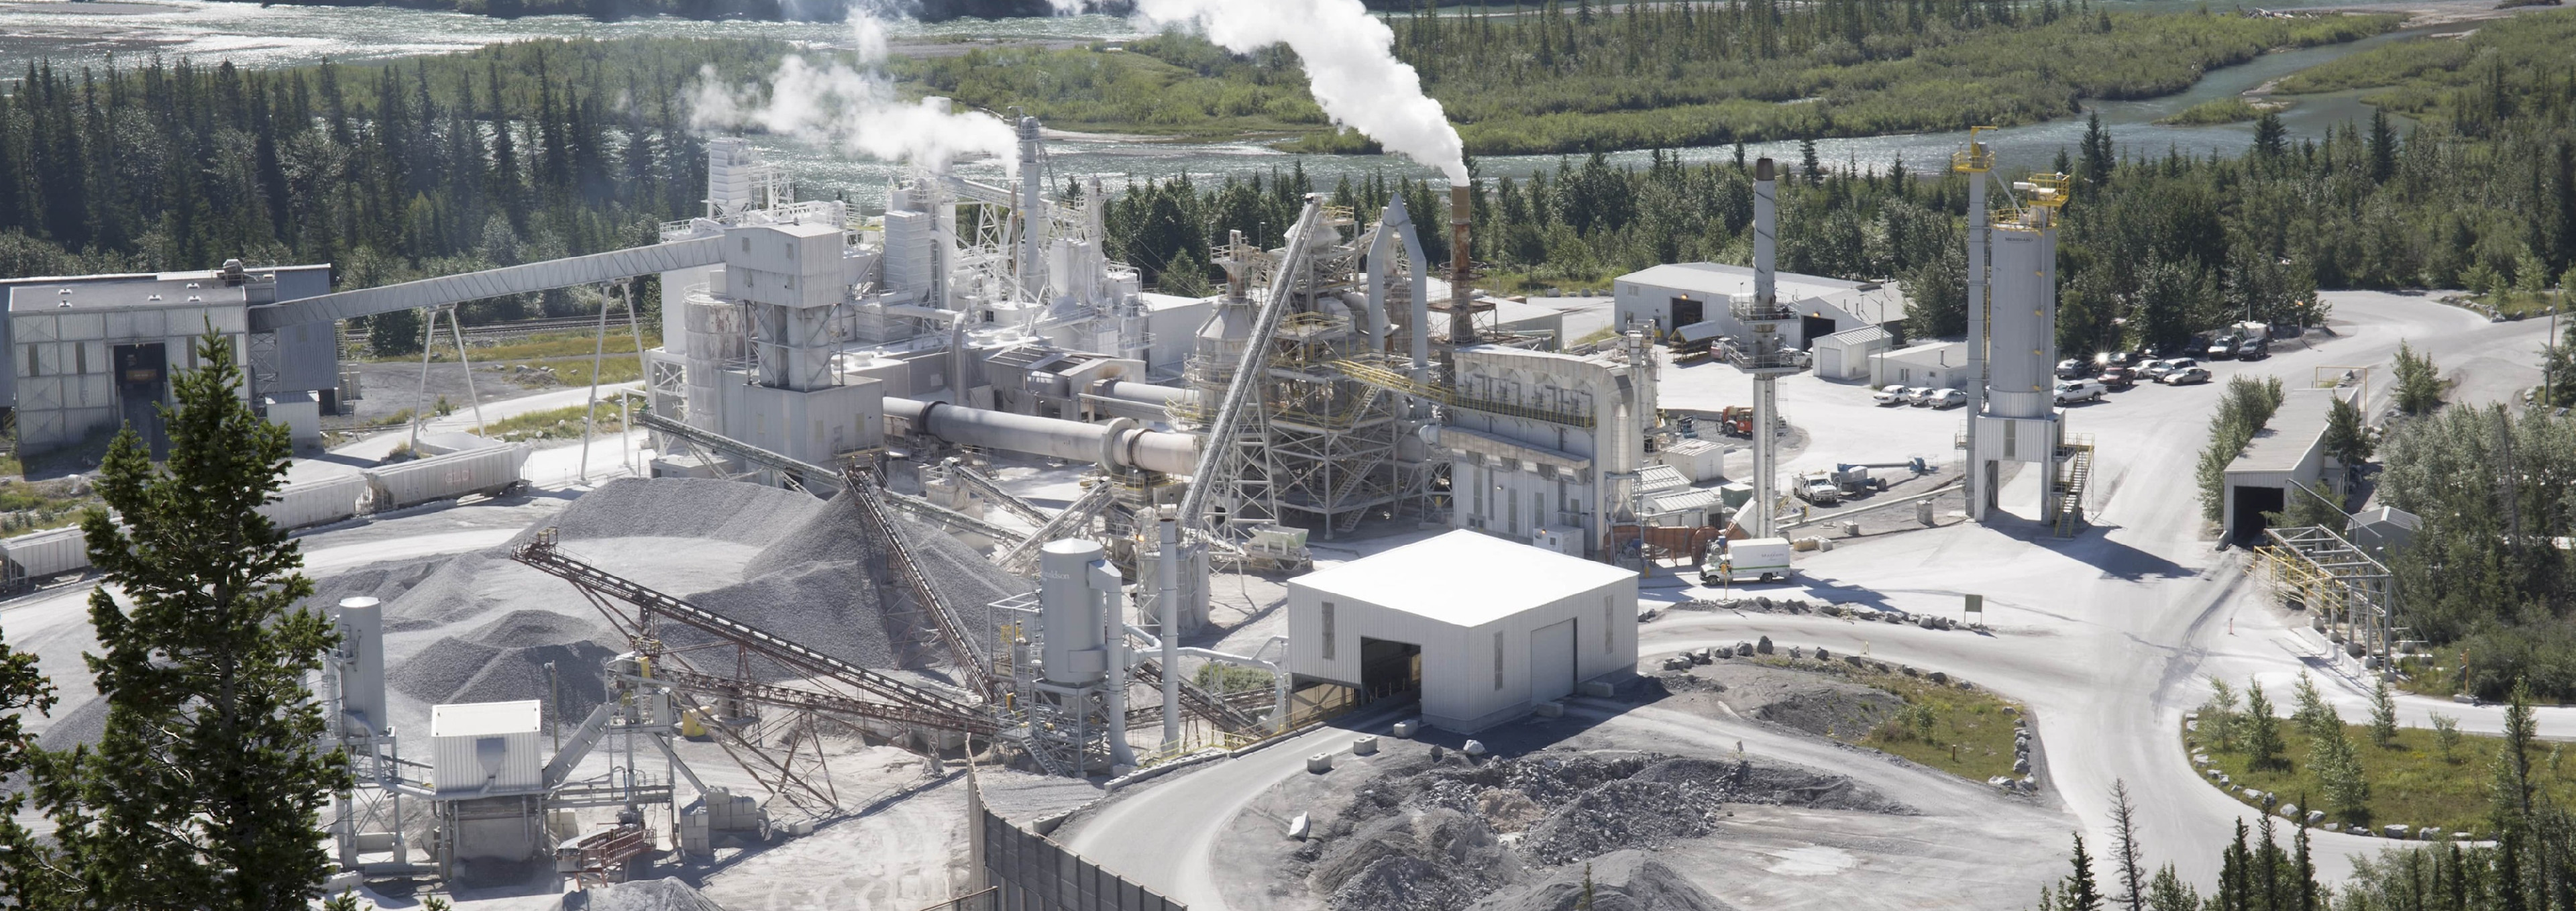
Cement is a key ingredient in concrete, the most used building material in the world. It is literally the stuff on which modern society is built. It is also carbon intensive to produce, emitting around 8% of the world’s carbon emissions.1
Despite high emissions its strength, versatility and low cost cements the industry’s growth for decades to come. That makes the Sector Decarbonization Pathway (SDP) model an essential tool for systematically assessing cement companies’ transition readiness.
The SDP model tracks the current and future decarbonization trajectories of companies against science-backed benchmarks, their capex in emissions-reducing technologies as well as the impact of future market dynamics and policy. Combined, they help us define a more concrete picture of how companies’ financial performance will evolve in the decades ahead as decarbonization trends intensify. Results help investors value transition risk of cement makers and adapt their portfolios according to their risk-return objectives.
The model uses the Transition Pathway Initiative (TPI) Below 2 °C Pathway as the industry decarbonization benchmark.2 The TPI Pathway charts the year-by-year reductions which the cement sector must make in order to ensure global temperatures stay well below the 2 °C limit by 2050. In addition, a year-by-year company decarbonization trajectory was created by combining the company’s past carbon emissions performance with future emission targets the company has voluntarily set (see Figure 1). Gaps between company decarbonization targets and the benchmark correlate to transition risk. The larger the gap, the bigger the risk.
Figure 1 – Company emission pathways vs the industry benchmark

The emissions reduction performance of an illustrative cement producer. The company’s pledged decarbonization targets (the Company Commitment Pathway) are denoted by the dotted red line. The solid green line is the Sector Benchmark Pathway which denotes the emission reductions required to reach the TPI. Source: Robeco, 2023.
Decarbonizing technologies
Using pathways to measure the gaps between company pathways and benchmark targets is just one part of assessing transition risk; but it doesn’t tell the full story. For this reason, we analyze companies’ future capital expenditures toward carbon-reducing technologies to get a more robust read on their true intentions. Although many decarbonizing technologies are under development, at present, only four are commercially ready. These include:
Substituting decarbonated raw materials for clinker production3
Increasing the use of low-carbon materials to reduce clinker content in cement
Burning more biomass and lower-emission fuels to heat clinker kilns
Upgrading manufacturing plants with energy-efficient equipment
Geography and local market variables, mean not all companies can fully realize emission reductions from these technologies. For example, quality substitute materials and fuels are not available in all markets, unfairly limiting the emission-reduction capacity of some developing regions. Moreover, many early adopters in developed markets have already maximized gains from plant upgrades, leaving less potential to be exploited. More importantly, the solutions listed can only reduce cement’s total emissions by 30-35%.4 Carbon capture utilization and storage (CCUS) are expected to further cut emissions by 30-36%. However, CCUS infrastructure, transport and storage is still immature and costly. It will take years of focused financing and continued built-out before it will be a workable solution for emission-reductions.
Figure 2 – Technologies needed to get cement to net zero

A roadmap showing the expected emissions reductions from installing decarbonization technologies and shifting more energy and emissions-efficient processes in the concrete manufacturing value chain.
Source: Concrete Future, The GCCA 2050 Cement and Concrete Industry Roadmap for Net Zero, 2023
Bringing it all together
Companies may set ambitious targets but whether they are truly committed and financially capable of fulfilling those targets will be revealed by the capex assessment. Our capex decarbonization metric calculates the difference between a company’s reported capex and the capex needed to reduce carbon intensities to the levels required by the benchmark.5 Negative gaps between actual and benchmark-required capex show companies are not investing enough and are expected to miss targets. Adopting technologies may also result in higher ongoing operational expenditure (e.g., transport and long-term carbon storage). In addition to credibility, capex and opex assessments offer a way of evaluating just how costly it will be to align with the industry benchmark and reduce its transition risk.
Capex assessment – a simplified example
To reach its 2030 target of a 14% emission-intensity reduction compared to 2021 (119.3 MtCO2), a European-based cement producer identified the reduction of clinker factor, the use of more alternative fuels to heat kilns as well as efficiency gains in manufacturing as key decarbonization technologies.
Based on these technologies, the SDP model estimates an abatement cost of CHF 39.4 per ton of CO2 (tCO2) produced annually compared to 2021. That makes the calculation for the annual costs to meet the 2030 targets:
(0.14)(119.3MtCO2)(39.4/tCO2) = EUR 689 million
This is a conservative estimate. The company has pledged to devote EUR 512 million per annum to green capex through 2025 to meet targets. Without regulatory support, this capex is insufficient per our model, reducing the reliability of the company’s 2030 targets.
Note: EUR/CHF exchange rate (1.0236 EUR = 1 CHF) sourced from Bloomberg market data, 29 April 2024.
Carbon pricing and policy costs
Our model would be incomplete without assessing the impact of carbon regulation on the expected costs of cement companies. At present, we only explicitly calculate the impact of the EU Emission Trading System (ETS) as it is the most developed and certain in terms of scope and roll-out. We calculate the expected carbon prices that companies face using its current exposure to EU markets (% of sales) and its total emissions in the ETS scope (net of free allowances). These input parameters can be modified to perform sensitivity analysis and validate the robustness of the estimated regulatory carbon costs.
An investment tool with multiple uses
The SDP for cement is an ideal tool for investors who want to allocate capital to transition leaders rather than divesting completely from hard-to-abate sectors. The SDP model reliably quantifies and assesses the current and future decarbonization performance of cement producers and can be used to predict cement’s future winners and likely losers as the net-zero transition gains momentum. The model’s analysis feeds into cement companies’ decarbonization and climate scores and helps inform fundamental analysis and portfolio management decisions of Robeco’s investment teams across asset classes.
Beyond portfolio management, Robeco’s Active Ownership team uses SDP analyses to stress the risks and opportunities related to their decarbonization performance and push for strategic change across industries and within companies.
Cement is just one of many high-emission sectors that must be decarbonized to reach net-zero targets. To help investors navigate these changes, Robeco has created a series of sector decarbonization pathways to measure how companies are adapting and the financial impact of their transition strategy. As net zero moves closer, we expect regulations, costs, and transition risks to intensify across industries, making sector decarbonization pathway data a critical input for all investment mandates, not just those which are climate focused.
Footnotes
1IEA, Cement Industry, Breakthrough Agenda Report, 2023. https://www.iea.org/reports/breakthrough-agenda-report-2023/cement
2The Transition Pathway Initiative (TPI) was selected from among many decarbonization frameworks including SBTi, IEA, CEMBUREAU. It includes only Scope 1 emissions that result directly from a company’s own operations. Though Scope 2 and 3 emissions in cement are significant, they are also complicated to quantify and limit the ability to do peer group and benchmark comparisons. In addition, all decarbonization pathways measure net emissions intensities per ton of cementitious product rather than the companies’ absolute emissions, the reporting standard recommended by the Global Cement and Concrete Association.
3Clinker is made from fusing limestone and clay at extremely high temperatures (1450°C) in furnaces (‘kilns’). Clinker is then grinded into a fine powder and active ingredients are added to produce cement. Clinker production is responsible for 90% of cement manufacturing’s CO2 emissions.
4Efficiency gains in design and construction of buildings and infrastructure projects can help reduce emissions in buildings and construction by another 20-22%, but these emissions are not in scope for cement manufacturers.
5This calculation considers a cement maker’s current asset mix, production volumes and overall capacity, operating geographies, efficiency of installed abatement technologies (e.g., alternative fuels use), and other variables that may influence demand, production volumes, and growth in emissions intensities.
了解最新的可持續性市場觀點
訂閱我們的電子報,探索塑造可持續投資的趨勢。
重要資料
本網站僅供《證券及期貨條例》(香港法例第571章)及其附屬法例所界定之專業投資者瀏覽及使用。 投資涉及風險。過往表現並不代表未來表現。本網站所載資料僅供參考之用,並不構成任何投資建議,亦非作出買賣任何證券或採納任何投資策略之要約或招攬。投資者不應僅憑本網站提供之資料作出投資決定,在作出任何投資決定前,應徵詢獨立意見(包括有關稅務影響之意見)。投資者應確保完全理解投資產品的相關風險,亦應考量自身投資目標及風險承受水平。投資乃閣下之個人決定。除非銷售投資產品的中介人已向閣下告知該投資產品適合閣下,並已解釋其符合閣下投資目標之原因,否則閣下不應投資。請參閱相關發售文件或其他法律文件,以獲取包括風險因素在內的進一步詳情。 本網站由荷寶投資管理香港有限公司發布,該公司受香港證券及期貨事務監察委員會(「證監會」)規管(中央編號:APU851)。本網站未經證監會審閱。 無法保證任何投資產品可實現其投資目標。概不就任何投資產品之表現或投資回報作任何聲明或承諾。投資的價值或會波動。本網站所載過往表現、推算或預測,均不應視作未來表現之保證或指標,且概不提供任何明示或暗示之保證。本網站內容建基於相信為可靠之來源,惟因應資料傳遞技術特性及須採用多項數據來源(包括第三方內容),故概不保證其準確性。所述觀點僅乃截至上述日期,或會隨市況變化而改變,可予更改而毋須另行通知。該等意見可能有別於其他荷寶投資專業人士之意見。因使用本材料或當中所載任何評論、意見或估算而引致之直接、間接或相應損失,荷寶概不承擔法律責任。荷寶並無責任更新本網站或任何網站內容。未經荷寶事先書面許可,不得複製、分發或刊發本網站任何材料。 除非另有說明,資料來源:荷寶。