Researcher


• 市場觀點
Real-life experience: Using ML and distance-to-default to predict distress risk
Tail risk is extremely relevant for investors. While small wins and losses are inherent to stock market investing, significant price crashes can be highly detrimental. Identifying stocks that are likely to experience severe price crashes is crucial.
作者


Head of Conservative Equities and Chief Quant Strategist
概要
- ML risk and distance-to-default signals are strong tail risk predictors
- Since strategy inception, these signals have beaten standard risk factors
- Our year-by-year analysis includes real-life stock examples
Traditional risk indicators like stock beta and return volatility are useful but limited as they rely on historical data. To better estimate tail risk, Robeco has incorporated advanced measures such as distance-to-default (DtD) since 2011, and more recently in 2021, a machine learning (ML) risk signal that identifies complex market patterns. This note reviews their performance, particularly focusing on out-of-sample results. It demonstrates that DtD and ML signals have outperformed traditional measures in real-life investment strategies, supported by practical examples and analysis.
The distance-to-default (DtD) signal, inspired by the Merton model1 , captures how close a firm is to defaulting on its debt. It’s a key concept in credit risk modelling, used by analysts and bond investors to assess a company's financial stability and the likelihood of credit default. In this model, stock equity is seen as a call option on the company's total value, including liabilities. This value is influenced by the volatility of the company's asset market value. The forward-looking nature of DtD offers additional insights compared to traditional metrics. Since 2011, an enhanced version of this proprietary distress risk measure is a negative screening tool for all our Quantitative Equity strategies, and has been integral to our stock selection model for Conservative Equities.2
The machine learning risk signal, introduced to our Quantitative Equity models in 2021, is trained to identify firms likely to suffer severe stock price crashes. ML techniques have several advantages, such as adapting to data patterns and capturing complex relationships like nonlinearities and interaction effects.3 For example, the empirical relationship between a firm’s financial leverage and its risk level is not linear. While firms with low or average leverage tend to have an average distress risk, those with high leverage are much more likely to experience significant price crashes. ML techniques excel at identifying such nonlinear relationships. 4

Active Quant: finding alpha with confidence
Blending data-driven insights, risk control and quant expertise to pursue reliable returns.
Data and analysis
Our evaluation focuses on comparing the out-of-sample performance of three distress indicators since their incorporation into real-life investment strategies:
50/50 combination of beta and volatility
DtD signal
ML distress signal
For this we include a year-by-year analysis, examples of individual stock price crashes, power curves and portfolio sorts.
Year-by-year analysis: Since integrating DtD into Robeco's strategies in 2011, the annual performance of the riskiest stocks has been tracked. In strong market years like 2013 and 2019, these stocks sometimes outperformed the market. However, during downturns (e.g., 2018 and 2022), as expected the high DtD stocks suffered more significant losses.Notably, during negative market years, emerging markets experienced more substantial drawdowns than developed markets. On average, DtD outperformed traditional beta/volatility measures by about 2 to 3% annually in both developed as well as emerging markets.
Individual stock examples: In 2022, many companies experienced substantial drops in market value, with the top ten losers declining by an average of 69.8%. Noteworthy cases include Silicon Valley Bank and Snap, which had poor DtD and ML risk signal scores at the beginning of the year. This highlights how DtD and ML can effectively predict individual stock crashes complementing traditional risk factors.
Power curves: A statistical tool commonly used to assess prediction accuracy is the power curve. In this analysis, all three indicators (beta & volatility, DtD, and ML) outperformed the no-predictability benchmark. The power curves for DtD and ML were further from the 45-degree line than the beta & volatility curve, indicating their superior predictive power. The ML signal had the highest area under the curve (AUC) score, followed by DtD and then the beta-volatility combination.
Figure 1 | Power curves for various predictors of distress
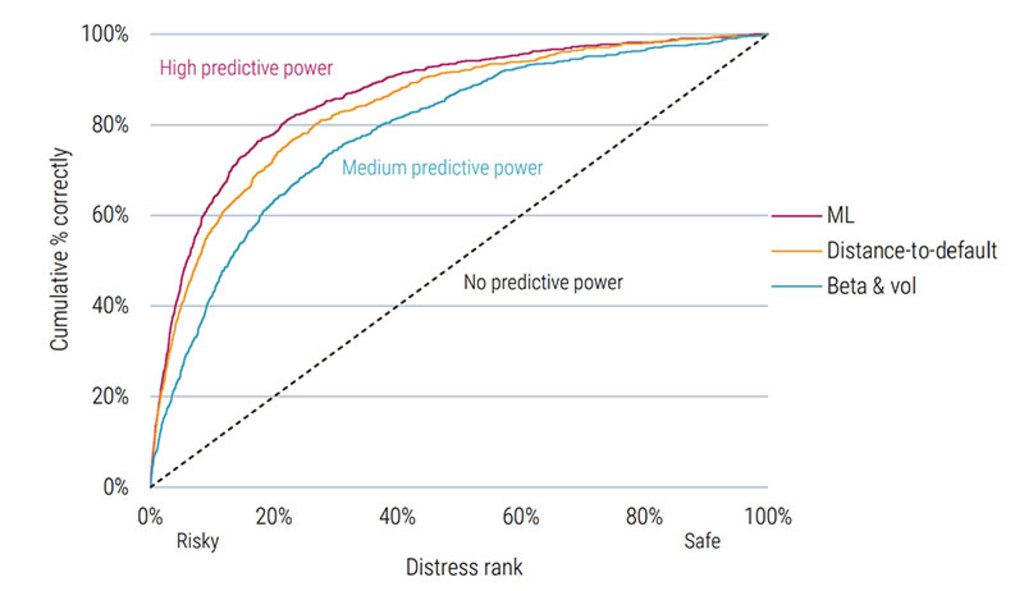
Global Developed Markets 2002-2023. Source: Robeco, MSCI, DataStream, Compustat and Worldscope, 2023.
Portfolio sorts: The analysis examined the 10% of stocks with the highest risk scores (beta & volatility, DtD, and ML). Stocks in these high-risk portfolios typically underperformed the market. The underperformance was more pronounced for DtD and ML compared to the beta-volatility basket. This indicates that advanced measures like DtD and ML are more effective in detecting risky stocks, and avoiding or shorting these stocks has historically led to higher returns.
Conclusion
This article presents detailed evaluations of proprietary tail risk predictors used in all of our Quantitative Equity strategies in general and Conservative Equities in particular, focusing on the comparison between traditional and advanced measures. Our analysis, which includes a year-by-year review, individual stock examinations, power curves and portfolio sorts, indicates that DtD and ML risk signals have added a distinct dimension to risk prediction since their inclusion in 2011 and 2021 respectively. These findings suggest a potential for improved identification of distressed stocks, which is a key consideration in strategy development and risk management.
Footnotes
1 Merton, R. C. (1974). On the pricing of corporate debt: The risk structure of interest rates. The Journal of finance, 29(2), 449-470.
2 How distress risk improves low volatility strategies: lessons learned since 2006, Joop Huij, Pim van Vliet, Weili Zhou and Wilma de Groot, Robeco Research Paper, February 2012
3 For an overview of the use of Machine Learning for asset management we refer to: Blitz, D., Hoogteijling, T., Lohre, H., & Messow, P. (2023). How can machine learning advance quantitative asset management? The Journal of Portfolio Management, 49(9), 78-95.
4 A more extensive description of the Machine Learning approach was published in 2021, at the time of introduction in our Quantitative Models, and can be found at: Forecasting stock crash risk with machine learning.
探索量化價值
訂閱我們的電子報,獲取尖端的量化策略和見解。
重要資料
本網站僅供《證券及期貨條例》(香港法例第571章)及其附屬法例所界定之專業投資者瀏覽及使用。 投資涉及風險。過往表現並不代表未來表現。本網站所載資料僅供參考之用,並不構成任何投資建議,亦非作出買賣任何證券或採納任何投資策略之要約或招攬。投資者不應僅憑本網站提供之資料作出投資決定,在作出任何投資決定前,應徵詢獨立意見(包括有關稅務影響之意見)。投資者應確保完全理解投資產品的相關風險,亦應考量自身投資目標及風險承受水平。投資乃閣下之個人決定。除非銷售投資產品的中介人已向閣下告知該投資產品適合閣下,並已解釋其符合閣下投資目標之原因,否則閣下不應投資。請參閱相關發售文件或其他法律文件,以獲取包括風險因素在內的進一步詳情。 本網站由荷寶投資管理香港有限公司發布,該公司受香港證券及期貨事務監察委員會(「證監會」)規管(中央編號:APU851)。本網站未經證監會審閱。 無法保證任何投資產品可實現其投資目標。概不就任何投資產品之表現或投資回報作任何聲明或承諾。投資的價值或會波動。本網站所載過往表現、推算或預測,均不應視作未來表現之保證或指標,且概不提供任何明示或暗示之保證。本網站內容建基於相信為可靠之來源,惟因應資料傳遞技術特性及須採用多項數據來源(包括第三方內容),故概不保證其準確性。所述觀點僅乃截至上述日期,或會隨市況變化而改變,可予更改而毋須另行通知。該等意見可能有別於其他荷寶投資專業人士之意見。因使用本材料或當中所載任何評論、意見或估算而引致之直接、間接或相應損失,荷寶概不承擔法律責任。荷寶並無責任更新本網站或任何網站內容。未經荷寶事先書面許可,不得複製、分發或刊發本網站任何材料。 除非另有說明,資料來源:荷寶。