Impact Specialist


• 市場觀點
Finland holds on to country sustainability title
Nordic nations and EU maintain their sustainability edge. Elsewhere, aging populations, climate change and incompetent governance hamper performance.
作者


Strategist
概要
- Influence and power of autocratic regimes may be weakening
- Democratic forces strengthen in Türkiye, but ESG performance still plummeting
- BRICS bloc still underperforming relative to potential
Finland narrowly edged out runner-up Sweden to retain the title of the world’s most sustainable country. Denmark overtook Norway for a spot in the top three while Switzerland, once again, rounded out the top five in the spring edition of the Country Sustainability Ranking.
With a five-notch move from October’s rankings, New Zealand broke into a top-ten traditionally dominated by European countries. Despite its emerging market status, Estonia ranked just below New Zealand at No. 11. The small Baltic state impressively maintains a sustainability performance that outshines bigger European economies including Ireland (No. 12), the UK (No. 13), France (No. 15), Luxembourg (No. 14) and Belgium (No. 24).
Moreover, climate and energy criteria continue to gain significance. Though some countries are making incremental gains, environmental scores continue to weigh down performance in multiple G20 countries including Canada (No. 16), Japan (No. 17) and Australia (No. 21). In contrast, better biodiversity and water efficiency marks helped elevate the US up slightly to position No. 36.
Sudan, Chad, and Libya in Africa and Iraq, Iran and Yemen in the Middle East rounded out the bottom of the 150-country list.
Figure 1: The global country sustainability ranking map¹
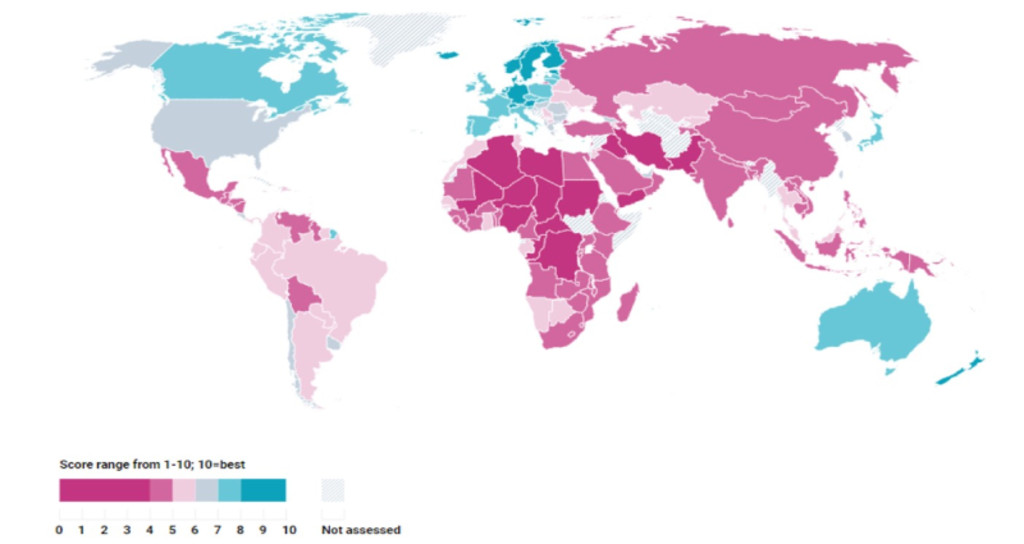
Data source: Robeco, country sustainability scores as of April 2023. Countries are color coded based on ESG scores.
Extreme inflation and a catastrophic earthquake helped galvanize a Turkish opposition, pushing it closer than ever to toppling the two-decade old regime of President Recep Tayyip. Though it mounted a formidable challenge, the opposition was, in the end, unable to release Türkiye from Erdoğan’s grip. The country’s deteriorating ESG position, which for decades has lagged emerging market peers, is set to continue its Erdoğan-era declines.
His authoritarian grip has left cultural, political, and economic institutions weak and unprepared for managing a dangerous mix of simmering environmental, social, and political risks. These include rising emissions, an aging population, reduced worker rights, constricted individual freedoms, and rampant corruption.
[Erdoğan’s] authoritarian grip has left cultural, political, and economic institutions weak and unprepared for managing a dangerous mix of simmering environmental, social, and political risks
Autocracy vs democracy
In addition to Türkiye, democracy has been under attack in regions across the world including Peru and Brazil in South America, Ethiopia and Tunisia in Africa, Myanmar and Thailand in Southeast Asia. However, these appear as mere skirmishes compared to Russia’s invasion of a sovereign Ukraine.
Meanwhile, China’s phenomenal rise in economic growth has challenged long-standing notions that democracy is superior to autocratic regimes. New research from the IMF counters those claims, showing that only a strong democracy provides the staples needed to spur innovation, advance economic development and build resilience to counter disruption. Moreover, recent results from Freedom House demonstrate that after two decades, the decline in democracy may have reached a nadir.
Japan’s aging demographics – an inverted pyramid
With nearly a third of its population over 65 and one of the world’s lowest fertility rates, Japan is staring at a demographic challenge of inverted proportions. Its old age dependency ratio stands at 51.2% (only the sunbaked, tax-light Principality of Monaco scored higher).
Aging demographics pose severe risks for public finances which Japan can scarcely afford. General government debt estimates for 2023 stand at 258% of GDP and are forecasted to reach 264% in 2028 – almost twice that of the US.2
Figure 2: An inverted pyramid – Japan’s aging demographics
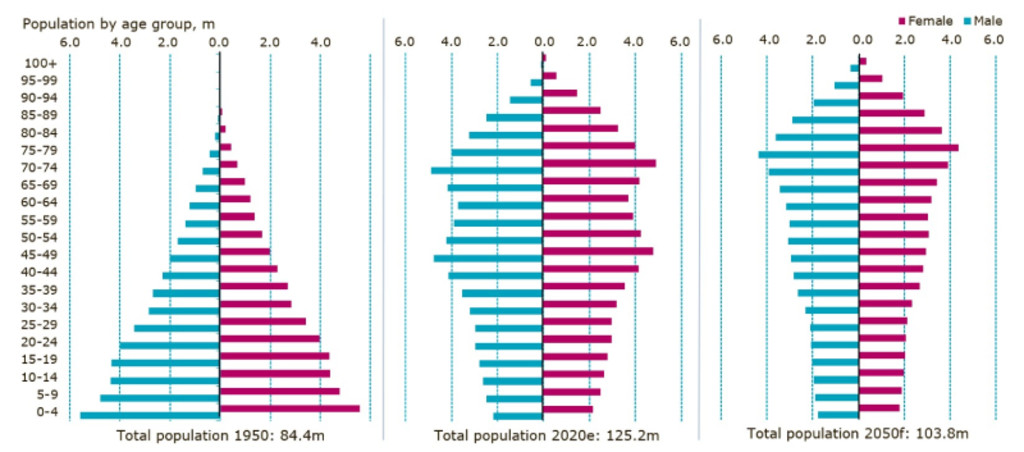
The chart shows the age distribution of Japan in year 1950 and 2020 and a forward-looking projection for 2050 based on current demographic trends. The bulk of the population rising to the elderly age brackets forming an inverted pyramid.
Source: Robeco, UN Population Division
Australia – a renewed climate ambition
Catastrophic floods and droughts are punishing Australia with increasing regularity, pushing the government to intensify efforts to fight climate change. In 2022, Australia joined the Global Methane pledge for reducing emissions in waste and energy sectors, increased its Nationally Determined Contributions (NDC) originally pledged under the Paris Agreement, and signed emission reduction plans into national law. This year it’s banning the use of carbon offsets to pull down emission in high-polluting industries.
[In Australia], an accelerated and smooth transition requires the rapid reskilling and transfer of workers from the fossil fuel to clean energy sector
Though moving in the right direction, Australia still has a long way to travel given its status as one of the world’s highest carbon emitters3 (See Figure 3). Energy dominates its exports and generates nearly half (47%) of total domestic emissions. The shift to renewable production (from the current 27% to 82% in 2030) will carry high social costs. An accelerated and smooth transition requires the rapid reskilling and transfer of workers from fossil fuel jobs to the clean energy sector.
Figure 3: Australia worse-off than OECD peers for climate and energy
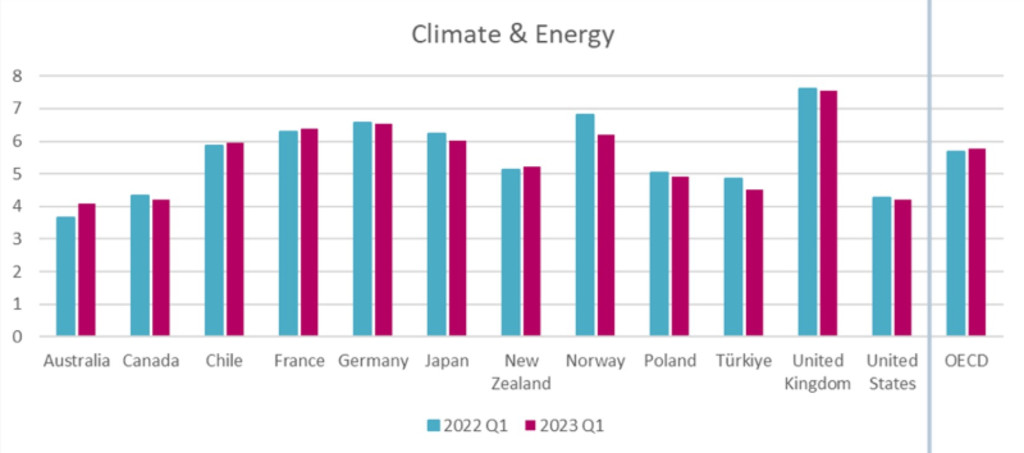
The chart displays Australia’s performance on the ‘Climate and energy’ criterion compared with that of major OECD countries and the OECD average comprised of 37 countries.
Data source: Robeco; data assessed as of April 2023
South Africa – untapped potential
Thanks to small gains in biodiversity, aging and political stability, China, India and Brazil saw small increases in scores and ranks. Still, the BRIC-bloc all scored in the lower half of the sustainability rankings, falling well short of their ESG potential. South Africa in particular is struggling.
Over the last year, South Africa has faced a series of crises. Infrastructure deficiencies have led to crippling power outages, extreme weather to water supply shortages, factional infighting to the worst civil unrest since the collapse of apartheid. Meanwhile, the Covid pandemic and continued geopolitical tensions abroad have hampered food imports, exacerbated already rampant income inequalities and slowed economic growth and development.
The one-time poster child for the economic power of emerging markets has over decades failed to address serious obstacles to growth including high unemployment, rampant corruption and insufficient investments into physical and social infrastructure. Even after more than five years in office, its current president Cyril Ramaphosa has been unable to enact meaningful reforms and sustainability performance as well as its sovereign credit rating have seen a steady state of declines since early-20094.
Footnotes
1 Complete scores and rankings can be obtained for free via Robeco’s SI Open Access portal. Visit Robeco’s global website for more information.
2 IMF Debt Map, https://www.imf.org/external/datamapper/GGXWDG_NGDP@WEO/JPN/CHN/DEU/USA
3 Based on OECD averages.
4 In 2007 and much of 2008, South Africa enjoyed investment grade credit ratings. Currently, the country is classified as sub-investment grade by Fitch (BB-), S&P (BB-), and Moody’s (Ba2).
獲取最新市場觀點
訂閱我們的電子報,時刻把握投資資訊和專家分析。
重要資料
本網站僅供《證券及期貨條例》(香港法例第571章)及其附屬法例所界定之專業投資者瀏覽及使用。 投資涉及風險。過往表現並不代表未來表現。本網站所載資料僅供參考之用,並不構成任何投資建議,亦非作出買賣任何證券或採納任何投資策略之要約或招攬。投資者不應僅憑本網站提供之資料作出投資決定,在作出任何投資決定前,應徵詢獨立意見(包括有關稅務影響之意見)。投資者應確保完全理解投資產品的相關風險,亦應考量自身投資目標及風險承受水平。投資乃閣下之個人決定。除非銷售投資產品的中介人已向閣下告知該投資產品適合閣下,並已解釋其符合閣下投資目標之原因,否則閣下不應投資。請參閱相關發售文件或其他法律文件,以獲取包括風險因素在內的進一步詳情。 本網站由荷寶投資管理香港有限公司發布,該公司受香港證券及期貨事務監察委員會(「證監會」)規管(中央編號:APU851)。本網站未經證監會審閱。 無法保證任何投資產品可實現其投資目標。概不就任何投資產品之表現或投資回報作任何聲明或承諾。投資的價值或會波動。本網站所載過往表現、推算或預測,均不應視作未來表現之保證或指標,且概不提供任何明示或暗示之保證。本網站內容建基於相信為可靠之來源,惟因應資料傳遞技術特性及須採用多項數據來源(包括第三方內容),故概不保證其準確性。所述觀點僅乃截至上述日期,或會隨市況變化而改變,可予更改而毋須另行通知。該等意見可能有別於其他荷寶投資專業人士之意見。因使用本材料或當中所載任何評論、意見或估算而引致之直接、間接或相應損失,荷寶概不承擔法律責任。荷寶並無責任更新本網站或任何網站內容。未經荷寶事先書面許可,不得複製、分發或刊發本網站任何材料。 除非另有說明,資料來源:荷寶。