Head of Solutions Research


• 市場觀點
Investing across deflation, inflation and stagflation
Real returns on equities and multi-asset portfolios are typically poor when inflation is high, especially in times of stagflation. Factor returns, on the other hand, are relatively insensitive to inflation cycles; hence they diversify asset class returns across various inflation buckets.
作者


Head of Conservative Equities and Chief Quant Strategist
概要
- Extensive analysis on inflation dynamics covering 146 years of data
- Equity and bond returns tend to be poor in times of high inflation, especially stagflation
- Factors offer consistent returns across inflation scenarios, providing diversification
After three decades of muted price increases, inflation has once again become a major talking point for investors. A confluence of factors such as the reopening of economies following protracted Covid-related lockdowns, supply chain bottlenecks, sharply rising commodity prices (particularly gas and oil) and Russia’s invasion of Ukraine have driven global inflation well beyond comfortable levels.
Given the prevalent environment, we believe it is worth looking into how risk premiums typically behave across different inflation regimes, such as periods of deflation or high inflation. In our study1, we examined the performance of asset classes and factors using a deep sample stretching back as far as 1875, thereby accounting for various and numerous inflation regimes.
In our analysis, we observed that inflation varied over time and was punctuated by periods of deflation, moderate inflation and high inflation. Moreover, there were a few periods during which high inflation coincided with a recession, i.e. stagflation. Figure 1 depicts the inflation cycle over our 146-year sample period, with the grey bars indicating recessions.
Figure 1 | Inflation cycles over 146-year period, January 1875 to December 2021
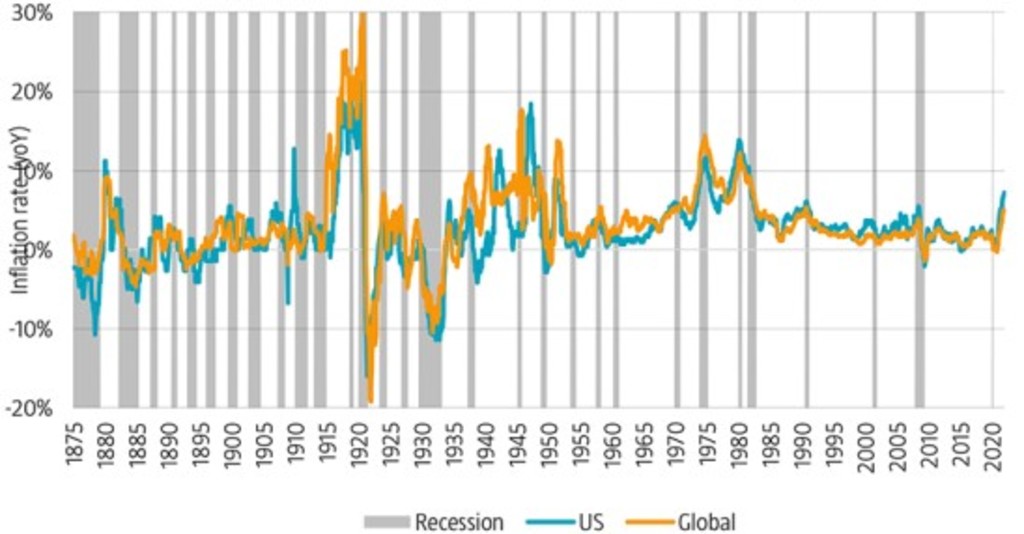
Source: The chart shows the inflation cycles from January 1875 to December 2021. For inflation we used year-on-year CPI data for France, Germany, Japan, UK and US from Datastream and MacroHistory.
To assess the impact of inflation on asset and factor returns, we chose to distinguish four broad types of inflation regimes: deflation (<0%), low inflation (0-2%), mildly overshooting inflation (2-4%) and high inflation (>4%). Table 1 summarizes the average annual returns for traditional asset classes across the different inflation buckets over our sample period.
Table 1 | Asset class returns across different inflation buckets, January 1875 to December 2021
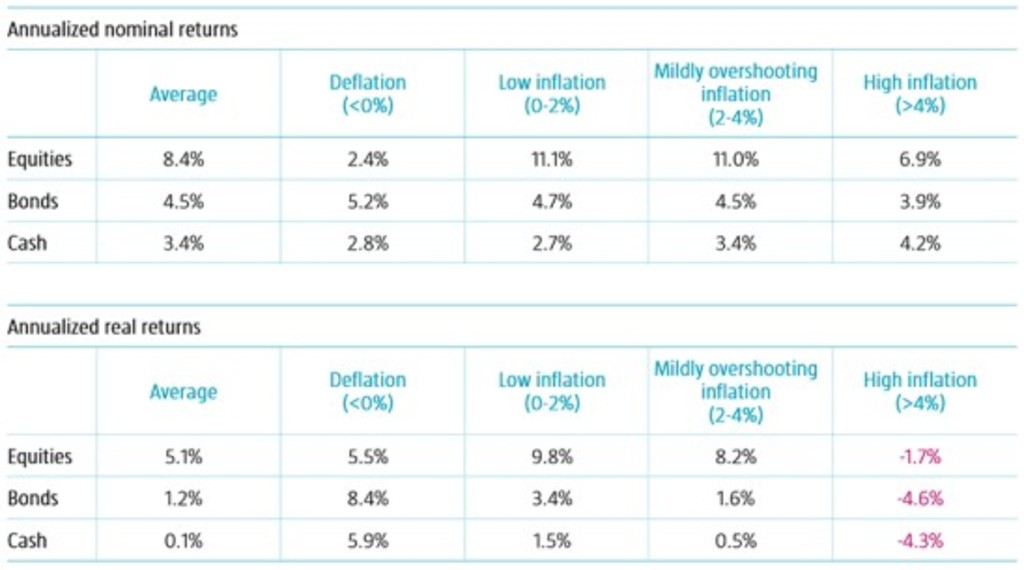
Source: The table shows the asset class returns across various inflation buckets from January 1875 to December 2021. For equities, we used return data from the MSCI World Index and before then global value-weighted equity market returns, see Baltussen, Swinkels and Van Vliet (2022). For bonds, we used return data from the Bloomberg Global Treasury Index and before then GDP-weighted bond returns across French, German, Japanese, UK and US bond markets, see Baltussen, Swinkels and Van Vliet (2022). For cash, we used return data based on short-dated US Treasuries from the Kenneth French library and before then data from Jeremy Siegel. For inflation we used year-on-year CPI data for France, Germany, Japan, UK and US from Datastream and MacroHistory. All returns are quoted in USD.
During deflationary periods, equities delivered nominal returns well below their average over the sample period, but above-average real returns due to the negative inflation. The outcome was similar for cash, with above-average real returns. Bonds benefited over this period, generating above-average nominal and real returns, with the latter being particularly strong.
In high inflation intervals, all the asset classes experienced positive returns, but equities and bonds lagged their averages. But more importantly, all asset classes delivered negative real returns as they failed to offset the heightened inflationary pressures.
The low inflation and mildly overshooting inflation scenarios reflect a ‘goldilocks’ environment, which is typically good for risk assets and was prevalent for more than half of the sample period. In line with expectations, equities displayed their strongest performance in these periods, attaining robust nominal and real returns. Meanwhile, bonds fared reasonably well, delivering nominal returns in line with their average and solid real returns. By contrast, nominal cash returns were below average, but positive in real terms.
We then assessed the impact of these different inflation regimes on a generic multi-asset portfolio that consists of 60% equities and 40% bonds. As depicted in Figure 2, we observed that the low inflation and mildly overshooting inflation buckets (‘goldilocks’ environment) were the sweet spot for multi-asset investors both in terms of nominal and real returns.
Figure 2 | Nominal and real returns of generic multi-asset portfolio across different inflation buckets, January 1875 to December 2021
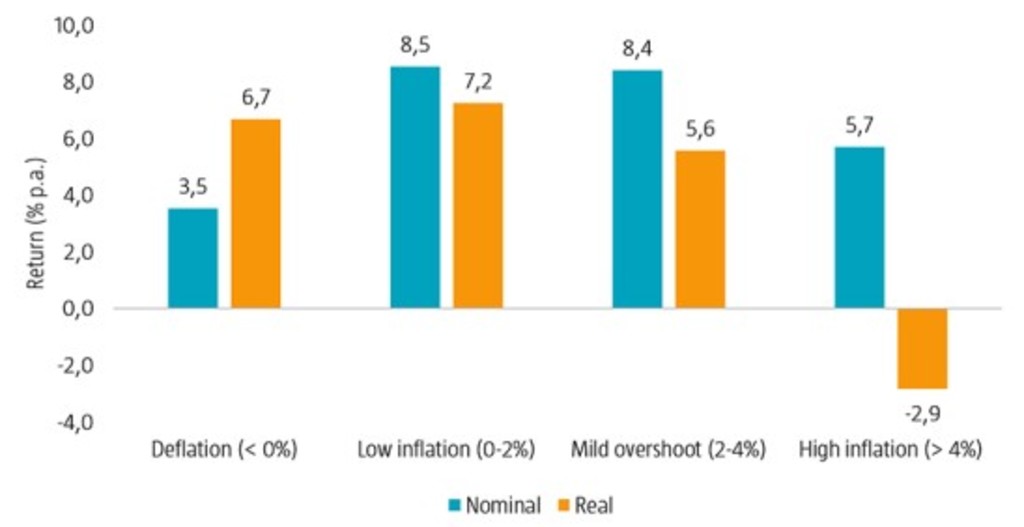
Source: The chart shows the nominal and real returns of a multi-asset portfolio across various inflation buckets from January 1875 to December 2021. For equities, we used return data from the MSCI World Index and before then global value-weighted equity market returns, see Baltussen, Swinkels and Van Vliet (2022). For bonds, we used return data from the Bloomberg Global Treasury Index and before then GDP-weighted bond returns across French, German, Japanese, UK and US bond markets, see Baltussen, Swinkels and Van Vliet (2022). The generic multi-asset portfolio consists of 60% equities and 40% bonds, rebalanced monthly. For inflation we used year-on-year CPI data for France, Germany, Japan, UK and US from Datastream and MacroHistory. All returns are quoted in USD.
In deflationary times, nominal returns from multi-asset portfolios were subdued, but materially better in real terms. By contrast, nominal multi-asset returns were solid in periods of high inflation, but these were eroded by heightened price pressures leading to negative real returns.
獲取最新市場觀點
訂閱我們的電子報,時刻把握投資資訊和專家分析。
Impact on factor premiums across various inflation regimes
We carried out the same exercise for factor premiums across both equities and government bonds. This is illustrated in Figures 3 and 4, where the factor returns are the differences in performance between a long portfolio with the highest factor exposures and a short portfolio with the lowest factor exposures. Interestingly, we saw that the performance of factors seemingly does not depend much on the level of inflation, in contrast to the asset class returns.
Indeed, Figure 3 shows that the multi-factor equity portfolio produced fairly stable performance across all four regimes. At the individual factor level, the variation in returns across inflation buckets was somewhat higher, but never strayed too far away from long-term averages.
Figure 3 | Equity factor premiums across different inflation buckets, January 1875 to December 2021

Source: The table shows equity factor returns across various inflation buckets from January 1875 to December 2021. For the equity factors, we used data from the Kenneth French library and Baltussen, Van Vliet and Van Vliet (2022)2 and methodology from the latter. The equity factor returns are based on the return spreads between the top and bottom factor quintile portfolios using US stocks. For inflation we used year-on-year CPI data for France, Germany, Japan, UK and US from Datastream and MacroHistory. All returns are quoted in USD.
The picture for bond factors was similar as they delivered positive returns in all four regimes as depicted in Figure 4, while the multi-factor bond portfolio performed consistently well in all inflation buckets. At the individual factor level, the variation in returns across the different inflation scenarios was higher, leading to a well-diversified multi-factor bond portfolio.
Figure 4 | Bond factor premiums across different inflation buckets, January 1875 to December 2021

Source: The table shows bond factor returns across various inflation buckets from January 1875 to December 2021. For the bond factors, we used data from Baltussen, Martens and Penninga (2022)3 and methodology from the latter. The bond factor returns are based on the return spreads between the top and bottom factor quintile portfolios. For inflation we used year-on-year CPI data for France, Germany, Japan, UK and US from Datastream and MacroHistory. All returns are quoted in USD.
Asset classes especially struggle during stagflation, but factors provide some reprieve
We acknowledge that not all inflation regimes are alike. Periods of high inflation that coincide with recession particularly stand out. We therefore scrutinized the impact of stagflation on asset class and factor premiums. We found that the nominal (-7.1%) and real (-16.6%) returns for equities were especially weak in these episodes. This suggests that the asset class is a poor hedge during these occasions.
The outcome was somewhat better for bonds as falling interest rates typically present tailwinds for the asset class. During these stagflationary intervals, bonds delivered a nominal return of 5.1%, but a real return of -4.4% due to the high levels of inflation. Overall, a generic multi-asset portfolio tended to struggle in this scenario as it produced nominal and real returns of -2.2% and -11.7%, respectively.
The picture was different when we looked at factor premiums. The multi-factor equity and multi-factor bond portfolios charted in positive territory with gains of 5.4% and 4.7%, respectively. Moreover, all equity and bond factor premiums performed well during stagflation, with the exception of the bond momentum factor which endured losses during these episodes. In other words, equity and bond factors also performed consistently in periods of stagflation, thereby providing some reprieve from poor asset class returns during these periods.
Conclusion
Our findings reveal that asset class premiums vary substantially across inflation regimes. Deflation and moderate inflation scenarios generally result in positive nominal and real equity and bond returns, while real returns suffer in times of high inflation, especially during periods of stagflation.
Meanwhile, equity and bond factor premiums are generally consistent across all inflation regimes, with marginal variations in returns across inflation regimes. Although this may sound unexciting, it does imply that factor investors should, on average, be less affected by inflation. As a result, we conclude that factors can help alleviate the pain during high inflation periods, albeit they are not a perfect hedge against inflation.
Footnotes
1 Baltussen, G., Swinkels, L., and Van Vliet, P., June 2022, “Investing in deflation, inflation, and stagflation regimes”, SSRN working paper.
2 Baltussen, G., Van Vliet, B., and Van Vliet, P., March 2022, “The cross-section of stock returns before 1926 (and beyond)”, SSRN working paper.,
3 Baltussen, G., Martens, M., and Penninga, O., January 2022, “Factor investing in sovereign bond markets: deep sample evidence”, Journal of Portfolio Management.
重要資料
本網站僅供《證券及期貨條例》(香港法例第571章)及其附屬法例所界定之專業投資者瀏覽及使用。 投資涉及風險。過往表現並不代表未來表現。本網站所載資料僅供參考之用,並不構成任何投資建議,亦非作出買賣任何證券或採納任何投資策略之要約或招攬。投資者不應僅憑本網站提供之資料作出投資決定,在作出任何投資決定前,應徵詢獨立意見(包括有關稅務影響之意見)。投資者應確保完全理解投資產品的相關風險,亦應考量自身投資目標及風險承受水平。投資乃閣下之個人決定。除非銷售投資產品的中介人已向閣下告知該投資產品適合閣下,並已解釋其符合閣下投資目標之原因,否則閣下不應投資。請參閱相關發售文件或其他法律文件,以獲取包括風險因素在內的進一步詳情。 本網站由荷寶投資管理香港有限公司發布,該公司受香港證券及期貨事務監察委員會(「證監會」)規管(中央編號:APU851)。本網站未經證監會審閱。 無法保證任何投資產品可實現其投資目標。概不就任何投資產品之表現或投資回報作任何聲明或承諾。投資的價值或會波動。本網站所載過往表現、推算或預測,均不應視作未來表現之保證或指標,且概不提供任何明示或暗示之保證。本網站內容建基於相信為可靠之來源,惟因應資料傳遞技術特性及須採用多項數據來源(包括第三方內容),故概不保證其準確性。所述觀點僅乃截至上述日期,或會隨市況變化而改變,可予更改而毋須另行通知。該等意見可能有別於其他荷寶投資專業人士之意見。因使用本材料或當中所載任何評論、意見或估算而引致之直接、間接或相應損失,荷寶概不承擔法律責任。荷寶並無責任更新本網站或任何網站內容。未經荷寶事先書面許可,不得複製、分發或刊發本網站任何材料。 除非另有說明,資料來源:荷寶。