Robeco logo

Disclaimer Robeco Switzerland Ltd.

The information contained on these pages is solely for marketing purposes.

Access to the funds is restricted to (i) Qualified Investors within the meaning of art. 10 para. 3 et sequ. of the Swiss Federal Act on Collective Investment Schemes (“CISA”), (ii) Institutional Investors within the meaning of art. 4 para. 3 and 4 of the Financial Services Act (“FinSA”) domiciled Switzerland and (iii) Professional Clients in accordance with Annex II of the Markets in Financial Instruments Directive II (“MiFID II”) domiciled in the European Union und European Economic Area with a license to distribute / promote financial instruments in such capacity or herewith requesting respective information on products and services in their capacity as Professional Clients.

The Funds are domiciled in Luxembourg and The Netherlands. ACOLIN Fund Services AG, postal address: Leutschenbachstrasse 50, CH-8050 Zürich, acts as the Swiss representative of the Fund(s). UBS Switzerland AG, Bahnhofstrasse 45, 8001 Zurich, postal address: Europastrasse 2, P.O. Box, CH-8152 Opfikon, acts as the Swiss paying agent.

The prospectus, the Key Investor Information Documents (KIIDs), the articles of association, the annual and semi-annual reports of the Fund(s) may be obtained, on simple request and free of charge, at the office of the Swiss representative ACOLIN Fund Services AG. The prospectuses are also available via the website https://www.robeco.com/ch.

Some funds about which information is shown on these pages may fall outside the scope of CISA and therefore do not (need to) have a license from or registration with the Swiss Financial Market Supervisory Authority (FINMA).

Some funds about which information is shown on this website may not be available in your domicile country. Please check the registration status in your respective domicile country. To view the Robeco Switzerland Ltd. products that are registered/available in your country, please go to the respective Fund Selector, which can be found on this website and select your country of domicile.

Neither information nor any opinion expressed on this website constitutes a solicitation, an offer or a recommendation to buy, sell or dispose of any investment, to engage in any other transaction or to provide any investment advice or service. An investment in a Robeco Switzerland Ltd. product should only be made after reading the related legal documents such as prospectuses, annual and semi-annual reports.

By clicking “I agree” you confirm that you/the company you represent falls under one of the above-mentioned categories of addressees and that you have read, understood and accept the terms of use for this website.

I Disagree

27-03-2025 · Insight

Quant chart: US Treasuries up for auction

Bond volatility presents opportunities for adding value through market timing. Our new research shows how novel duration signals can capture short-term inefficiencies, offering a diversifying alpha source for government bond strategies.

    Authors

  • Patrick Houweling - Head of Quant Fixed Income

    Patrick Houweling

    Head of Quant Fixed Income

  • Olaf Penninga - Portfolio Manager

    Olaf Penninga

    Portfolio Manager

  • Fabio Martinetti - Researcher

    Fabio Martinetti

    Researcher

The ups and downs of Treasury Note futures

With a national debt of USD 36 trillion and a budget deficit of USD 307 billion in February alone, the US has to sell a substantial volume of bonds. Every month, the US Department of the Treasury sells approximately USD 40 billion in 10-year Treasury Notes at a single auction – followed the next day by an auction of over USD 20 billion in 30-year bonds. This sudden influx of new supply temporarily puts pressure on the market.

The future on the US 10-year Treasury Note is one of the most liquid instruments in the world, with up to 239,000 contracts exchanged in a single minute. Based on an intraday dataset consisting of 382 million transactions in this futures contract, we investigated the impact of these auctions. This fascinating dataset allows us to observe and analyse market movements with great precision.

The intraday chart in Figure 1 illustrates a clear pattern: ahead of the auction, on average futures prices decline by 6 basis points, only to recover in the hours that follow.

Figure 1 | Auction impact

Figure 1 | Auction impact

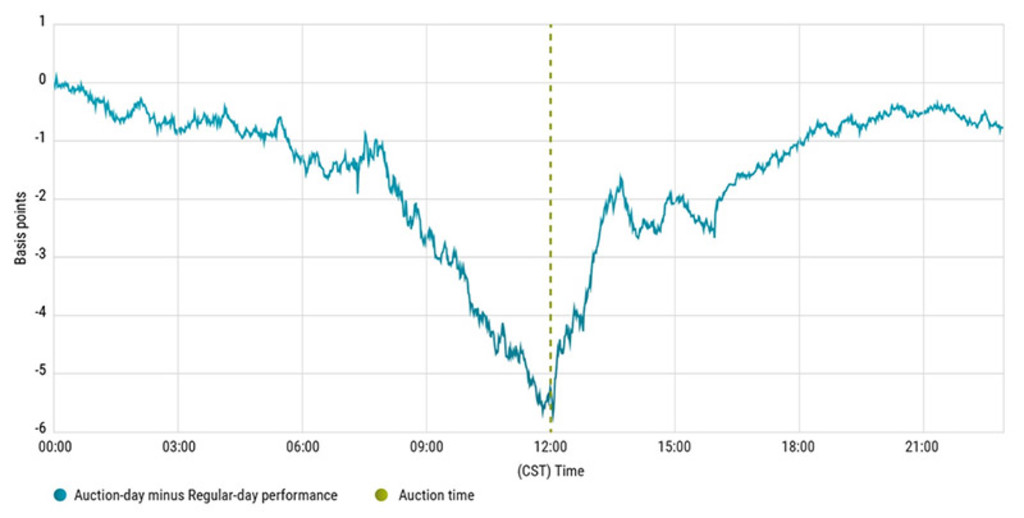
Source: Tickdata, TreasuryDirect. The figure shows the difference in the performance of the US 10-year T-Note futures on the day of a US 10-year auction vs a regular day. Sample January 1983 to August 2024.

Quant Charts

Turning market patterns into opportunity

We can benefit from this pattern by taking a short position in government bond futures ahead of the auction, and then switching to a long position just before prices begin to rebound. Our research identifies optimal positioning to efficiently capture this liquidity premium, while carefully taking risk considerations and transaction costs into account.

This auction-based strategy is the first shorter-term signal that we’ve implemented in government bond markets, adding a new, uncorrelated source of alpha to our long-standing Dynamic Duration strategy.

Read more in our recent article on bonds and market timing: Bonds are back: Mastering market timing for long-term success.

QI Global Dynamic Duration FH EUR

performance ytd (30/04)
0.94%
Performance 3y (30/04)
-0.41%
since inception (30/04)
0.49%
total size of fund (30/04)
636mln
morningstar (30/04)
View the fund
Past performance is no guarantee of future results. The value of the investments may fluctuate. Annualized (for periods longer than one year). Performances are net of fees and based on transaction prices.

Discover the value of quant

Subscribe for cutting-edge quant strategies and insights.

Explore quant