Researcher
Active Quant: finding alpha with confidence
Blending data-driven insights, risk control and quant expertise to pursue reliable returns.






Emerging markets have proven to be fruitful for well-established equity factors. Moreover, our research shows that these generic equity factors can be substantially enhanced for emerging markets.






Emerging markets account for around 58% of global GDP and this is forecasted to rise to 61% by 2026.1 Furthermore, more than 70% of the world’s population lives in these countries. However, emerging markets only represent about 12% of the MSCI All Country Index.
That said, the outlook for emerging markets has improved. As a group, emerging market stocks are cheaper than their developed market peers, partly due to the former lagging the latter in terms of performance over the last ten years. Thus on valuation grounds, they present an attractive prospect for global investors. Furthermore, our research shows there is a strategic case for allocating to emerging markets on an overall portfolio level.2
The macroeconomic backdrop could also provide support for emerging markets, given the group has a substantial current account surplus and is less troubled by inflation. Moreover, some individual countries even have room for fiscal and monetary stimulus.3 And while sustainable investing in emerging markets is considered challenging, our recent study illustrates that sustainable emerging market companies are actually as ‘green’ as those in developed markets.4

Blending data-driven insights, risk control and quant expertise to pursue reliable returns.
Historically, well-established factors have delivered solid performance in emerging markets. This is depicted in Figure 1 which highlights the annualized Sharpe ratios of both generic and enhanced value, quality, momentum and multi-factor (25% value, 25% quality, and 50% momentum) portfolios.
While generic value (book to market), quality (return on equity) and momentum (price momentum) factors exhibit positive Sharpe ratios ranging roughly between 0.1 and 0.6, their multi-factor combination achieves a Sharpe ratio of 0.8 due to diversification benefits.
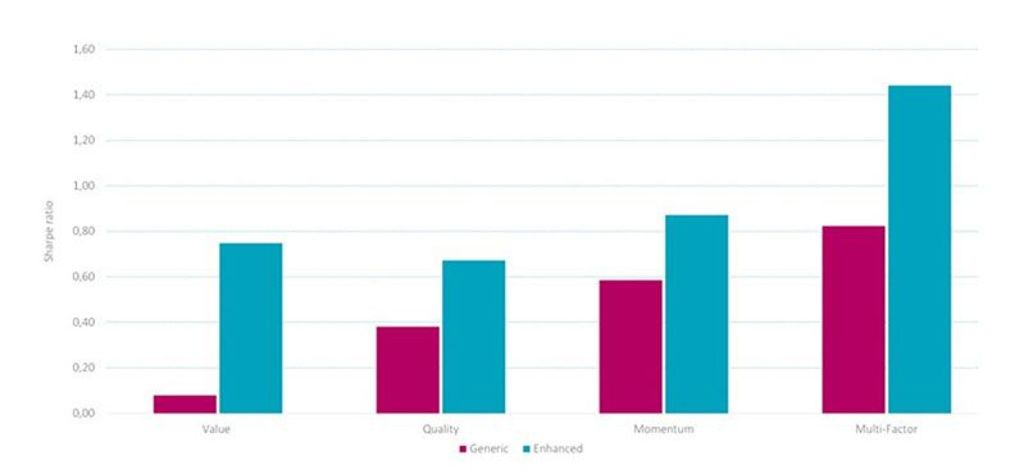
Source: Refinitiv, Robeco. The figure shows the annualized Sharpe ratio of generic versus enhanced value, quality, momentum and multi-factor (25% value, 25% quality, and 50% momentum) composite factors. Factor returns are the return spreads between the top and bottom factor quintile portfolios. Portfolios are equal-weighted, rebalanced monthly and the holding period is six months. The investment universe consists of the non-financial constituents of the MSCI Emerging Markets Index. Before 2001, we use the largest 800 constituents of the S&P Emerging BMI at the semi-annual index rebalance going back to December 1995. The sample period is January 1996 to July 2022.
Our research demonstrates that these generic definitions can be substantially enhanced.5 For instance, the enhanced value composite6 that considers a broader range of fundamentals, such as earnings, cashflows, payouts, and intangible-adjusted book value, boosts the Sharpe ratio to nearly 0.8.
Similarly, a composite of quality metrics that has been shown to predict future growth in profitability (gross profitability, accruals, and investments)7 nearly doubles the Sharpe ratio compared to backward-looking return on equity.
While generic price momentum offers an attractive Sharpe ratio of almost 0.6, price momentum returns are also highly negatively skewed, exposing them to large drawdowns from time to time. Our research shows that a momentum composite that also considers residual8 and earnings momentum (price momentum, residual price momentum and analysts’ earnings revisions) exhibits a higher premium and significantly moderates these momentum crashes.
Finally, the enhancements of the individual factors also translate to the multi-factor level (again 25% value, 25% quality, and 50% momentum) as the Sharpe ratio for the multi-factor combination increases from 0.8 to about 1.4.
1IMF, April 2022, “World economic outlook database”, IMF.
2De Groot, W., and Zhou, W., October 2018, “Strategic allocation to emerging markets factor premiums”, Robeco white paper.
3Van Rijn, A., June 2022, “Anyone for hiking this summer?”, Robeco article.
4De Groot, W., and Sulman, V., June 2022, “Marrying sustainability and emerging markets expertise in quantitative strategies”, Robeco article.
5Robeco has published numerous papers on emerging markets over the last two decades. See for example: van der Hart, J., Slagter, E., and van Dijk, D., 2003, “Stock selection strategies in emerging markets”, Journal of Empirical Finance; van der Hart, J., de Zwart, G., and van Dijk, D., 2005, “The success of stock selection strategies in emerging markets: Is it risk or behavioral bias?”, Emerging Markets Review; Blitz, D., Pang, J., and van Vliet, P., 2013, “The volatility effect in emerging markets”, Emerging Markets Review; Hanauer, M. X., and Lauterbach, J. G., 2019, “The cross-section of emerging market stock returns”, Emerging Markets Review.
6Blitz, D., and Hanauer, M. X., January 2021, “Resurrecting the value premium”, Journal of Portfolio Management.
7Kyosev, G., Hanauer, M. X., Huij, J., and Lansdorp, S., May 2020, “Does earnings growth drive the quality premium”, Journal of Banking and Finance.
8Lansdorp, S., October 2013, “Robeco’s residual momentum: less risky and more sustainable”, Robeco article.
訂閱我們的電子報,獲取尖端的量化策略和見解。
本網站僅供《證券及期貨條例》(香港法例第571章)及其附屬法例所界定之專業投資者瀏覽及使用。 投資涉及風險。過往表現並不代表未來表現。本網站所載資料僅供參考之用,並不構成任何投資建議,亦非作出買賣任何證券或採納任何投資策略之要約或招攬。投資者不應僅憑本網站提供之資料作出投資決定,在作出任何投資決定前,應徵詢獨立意見(包括有關稅務影響之意見)。投資者應確保完全理解投資產品的相關風險,亦應考量自身投資目標及風險承受水平。投資乃閣下之個人決定。除非銷售投資產品的中介人已向閣下告知該投資產品適合閣下,並已解釋其符合閣下投資目標之原因,否則閣下不應投資。請參閱相關發售文件或其他法律文件,以獲取包括風險因素在內的進一步詳情。 本網站由荷寶投資管理香港有限公司發布,該公司受香港證券及期貨事務監察委員會(「證監會」)規管(中央編號:APU851)。本網站未經證監會審閱。 無法保證任何投資產品可實現其投資目標。概不就任何投資產品之表現或投資回報作任何聲明或承諾。投資的價值或會波動。本網站所載過往表現、推算或預測,均不應視作未來表現之保證或指標,且概不提供任何明示或暗示之保證。本網站內容建基於相信為可靠之來源,惟因應資料傳遞技術特性及須採用多項數據來源(包括第三方內容),故概不保證其準確性。所述觀點僅乃截至上述日期,或會隨市況變化而改變,可予更改而毋須另行通知。該等意見可能有別於其他荷寶投資專業人士之意見。因使用本材料或當中所載任何評論、意見或估算而引致之直接、間接或相應損失,荷寶概不承擔法律責任。荷寶並無責任更新本網站或任何網站內容。未經荷寶事先書面許可,不得複製、分發或刊發本網站任何材料。 除非另有說明,資料來源:荷寶。
警告 — 有不法分子在網站及社交媒體上冒用荷寳 了解更多