PhD, Head of Robeco Indices


• 市場觀點
Indices insights: Can passive investors integrate sustainability without sacrificing returns or diversification?
In the third article of the Indices insights series, we highlight how sustainability integration is an accessible choice for passive investors. We demonstrate that carbon footprint reduction and SDG integration can be implemented without compromising investors’ financial objectives.
作者




PhD, Portfolio Manager Robeco Indices
概要
- Carbon footprint reduction and SDG integration are viable options for passive investors
- Sustainable passive solutions can enjoy similar risk-return characteristics to the market
- These strategies don’t have to miss out on the diversification benefits of market cap indices
One of the main advantages of passive investing is that such strategies track market indices that offer investors broad diversification in their quest to earn an equity premium. That said, sustainability is now a key consideration for many investors, including those taking the passive route.
In the two previous ‘Indices insights’ articles, we analyzed how different sustainability ratings align with values-based exclusions and thematic impact strategies. We concluded that, for investors who are focused on aligning their portfolios with positive impact, SDG scores are more useful than ESG ratings. In this article, we will look closely at the implications of integrating sustainability aspects into passive solutions from an investment perspective.
An oft-heard concern is that a more selective investment approach, as when incorporating sustainability, likely leads to lower returns and less diversification. Thus, a key question is whether the risk-return outcomes of passive investing can be attained only by investing in all index constituents, or if a more selective approach – such as excluding high carbon emitters or companies that have a negative impact on the SDGs – can also suffice.
In investigating this notion, we ran a few simulations where we applied sustainability screens. In particular, we constructed portfolios that avoided positions in sub-industries with the highest carbon footprint, or excluded investments in stocks that contribute negatively to the SDGs. We compared the performance of these alternative sustainable passive solutions to the unconstrained portfolios that were allowed to invest in both ‘brown’ and ‘green’ industries.

訂閱 – 指數洞察
時刻把握荷寶最新可持續性、因子及市場觀點文章。
Figure 1 | Return, risk and diversification characteristics are virtually identical for all three passive solutions
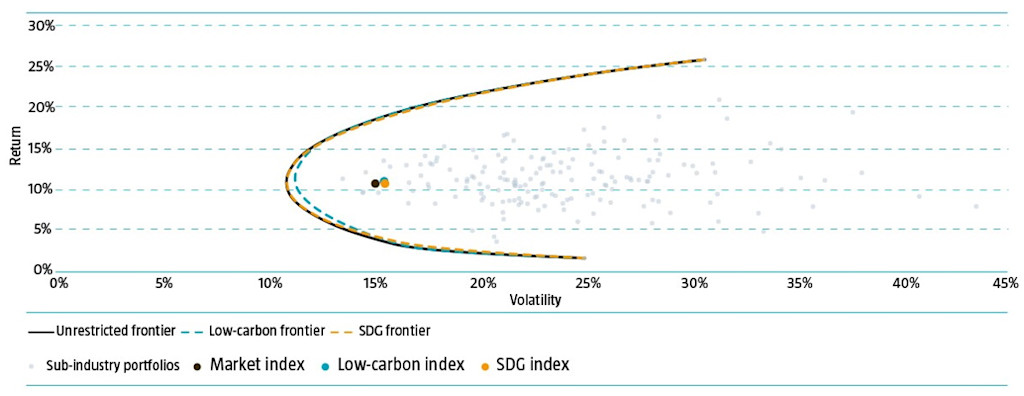
Source: FTSE, MSCI, Robeco. The sample period is January 1986 to November 2021.
As shown in Figure 1, we found that employing a simple low-carbon (blue dot) or positive SDG investment approach (orange dot) did not lead to lower historical returns compared to investing in the market index (black dot). The risk levels of the three passive solutions were also similar. The ‘efficient frontiers’ represent the set of optimal portfolios that offered the highest return for a defined level of volatility. Thus, the chart indicates that the potential diversification benefits were virtually identical for a more selective approach that incorporates sustainability (Low-carbon frontier and SDG frontier) and an unrestricted proposition (Unrestricted frontier).
Data and methodology
For our analysis, we used the monthly US dollar returns of FTSE World Developed Index constituents before January 2001 and of MSCI World Index constituents thereafter. The full sample period of our investigation spanned from January 1986 to November 2021. For each month, we constructed market-cap weighted sub-industry portfolios based on the GICS1 classification of stocks.
The sub-industry classification is the most granular within the GICS methodology and resulted in 158 different portfolios as at the end of our sample period. However, certain sub-industries have not always existed, while others have ceased. And in some cases, there were no developed large- or mid-cap stocks that belonged to a sub-industry. Therefore, we used the market index return for the months in which there were no returns at the sub-industry level.
For all sub-industries, we assigned SDG scores based on Robeco’s proprietary SDG framework. The framework provides a clear, objective, consistent and replicable approach to measuring the contributions that companies make to the 17 SDGs. Our method resulted in a baseline sub-industry assessment of the goods produced and/or services provided by a company and how these impacted the SDGs.
Sub-industries that make a positive impact receive SDG scores of +1 to +3 (low positive to high positive), depending on the strength and quality of their contributions. For example, positive contributions can be related to healthcare, medicine and water. Similarly, sub-industries that have a negative impact attain SDG scores of -1 to -3 (low negative to high negative), depending on the severity of their adverse impact. For instance, negative contributions can be linked to gambling, fast food and shale gas. In our analysis, we assumed the SDG scores are fixed over the full sample period.
For our investigation, we avoided any exposure to sub-industries with negative SDG scores when we constructed the SDG-aware portfolios. Similarly, we first ranked all sub-industries on their carbon footprints as at the end of our sample period. Thereafter, we excluded the most pollutive ones when we constructed the low-carbon portfolios. We assumed that present-day high-carbon sub-industries were also high-carbon sub-industries historically.
We then simulated the full sample return and volatility: for each market-cap-weighted sub-industry portfolio, the market index (market-cap-weighted combination of sub-industries), low-carbon index (market index excluding high carbon footprint sub-industries), and SDG index (market index excluding sub-industries with negative SDG scores).
Moreover, we constructed three different efficient frontiers, as depicted in Figure 1. The unrestricted frontier is based on the full universe, the low-carbon frontier is based on a more limited pool as it has zero exposure to high carbon footprint sub-industries, and the SDG frontier is based on a more restricted group as it excludes sub-industries with negative SDGs. These were constructed using historical sub-industry returns, and as such, are based on hindsight knowledge. It is also important to note that, by definition, the restricted frontiers (Low carbon and SDG) cannot lie north or west of the unrestricted frontier.
Conclusion
Given the findings from our analysis, we conclude that integrating sustainability aspects as an investment restriction can result in risk-return characteristics and diversification benefits that are similar to those of passive market-cap indices over the long term. Therefore, we believe sustainability considerations such as carbon footprint reduction and SDG integration are viable options for passive investors.
In the next ‘Indices insights’ articles, we will scrutinize the effects of sustainability integration in the context of active and factor investing approaches as opposed to a passive investment proposition. Specifically, we will first analyze the implications of applying sustainability screens on the factor characteristics of the investable universe. Then we will investigate if the applications of such screens lead to lower expected factor premiums and, if so, to what extent.
Footnote
1The Global Industry Classification Standard (GICS) is an industry taxonomy developed by MSCI and Standard & Poor's. It is a four-tiered, hierarchical industry classification system.
Background to sustainability metrics
In defining sustainability, investors have a multitude of dimensions and metrics they could consider. For example:
Values-based exclusions
ESG integration
Impact investing
ESG scores typically put more focus on the operations of a business, whereas SDG scores also incorporate the impact that the business’ products and/or services have on society.
We see client sustainability objectives increasingly moving towards avoiding controversial businesses (values-based exclusions) and including those that provide sustainable solutions (impact investing). In the first few articles of our Indices Insights series, we will empirically show how the different sustainability metrics (negative screening/exclusions, ESG, SDG) relate to these increasingly impact-oriented client sustainability objectives.
指數洞察
重要資料
本網站僅供《證券及期貨條例》(香港法例第571章)及其附屬法例所界定之專業投資者瀏覽及使用。 投資涉及風險。過往表現並不代表未來表現。本網站所載資料僅供參考之用,並不構成任何投資建議,亦非作出買賣任何證券或採納任何投資策略之要約或招攬。投資者不應僅憑本網站提供之資料作出投資決定,在作出任何投資決定前,應徵詢獨立意見(包括有關稅務影響之意見)。投資者應確保完全理解投資產品的相關風險,亦應考量自身投資目標及風險承受水平。投資乃閣下之個人決定。除非銷售投資產品的中介人已向閣下告知該投資產品適合閣下,並已解釋其符合閣下投資目標之原因,否則閣下不應投資。請參閱相關發售文件或其他法律文件,以獲取包括風險因素在內的進一步詳情。 本網站由荷寶投資管理香港有限公司發布,該公司受香港證券及期貨事務監察委員會(「證監會」)規管(中央編號:APU851)。本網站未經證監會審閱。 無法保證任何投資產品可實現其投資目標。概不就任何投資產品之表現或投資回報作任何聲明或承諾。投資的價值或會波動。本網站所載過往表現、推算或預測,均不應視作未來表現之保證或指標,且概不提供任何明示或暗示之保證。本網站內容建基於相信為可靠之來源,惟因應資料傳遞技術特性及須採用多項數據來源(包括第三方內容),故概不保證其準確性。所述觀點僅乃截至上述日期,或會隨市況變化而改變,可予更改而毋須另行通知。該等意見可能有別於其他荷寶投資專業人士之意見。因使用本材料或當中所載任何評論、意見或估算而引致之直接、間接或相應損失,荷寶概不承擔法律責任。荷寶並無責任更新本網站或任何網站內容。未經荷寶事先書面許可,不得複製、分發或刊發本網站任何材料。 除非另有說明,資料來源:荷寶。