Head of Conservative Equities and Chief Quant Strategist


• 研究
Research on pre-1926 database reveals equity factors are ‘eternal’
New research reveals that equity factor styles have existed and
persisted since the mid-19th century. This is based on a groundbreaking
US stock database that has been built by a team of Robeco researchers,
led by Guido Baltussen, in collaboration with the Erasmus University.
This underlines that factor premiums do not depend on specific market
regimes, which is good news for long-term quant investors.
作者

概要
- Authors constructed a novel US stock database, from 1866 to 1926
- Low risk, Momentum and Value premiums are significant in this era
- Analysis showcases the potential of machine learning techniques
Over the last few decades, asset pricing literature has uncovered numerous equity factors, such as low risk, momentum and value, that explain cross-sectional differences in stock returns. The empirical evidence presented in support of these findings has largely relied on the Center for Research in Security Prices (CRSP) database, which houses US stock data – including returns – dating all the way back to 1926.
This sample period has been so intensively analyzed that many experts have warned that studies on factors could potentially be plagued by data dredging or p-hacking effects.1 In other words, many of the factors that seem important in-sample could lose explanatory power, or even fail to hold up out-of-sample. This issue can be addressed with a truly independent and sufficiently large dataset that can be used for out-of-sample testing.
Regarding the latter, Guido Baltussen, Bart van Vliet and Pim van Vliet (from our Quantitative Investing team), in collaboration with the Erasmus University, have constructed a novel US stock database for the period 1866 to 1926, containing stock prices, dividend yields and market capitalization values. This huge effort, spanning over several years, entailed the hand-collection of market capitalization data, double-checking of all inputs, as well as data cleaning and adjustments for stock delistings and stock splits using digitalized financial journals. The team then merged this information with data from an external data provider – Global Financial Data – for the same period.
This ‘pre-CRSP’ sample period is of similar length to the one used in existing CRSP-based studies (61-years), and covers an economically important period that is independent to prevailing datasets. This era was characterized by strong economic growth and rapid industrial development, laying the foundations for the preeminence of the US economy. Meanwhile, the US stock market played a pivotal role in economic growth and the financing of key innovations during this phase.
The novel database provides new ground for independent tests, that can allow us to better understand return drivers and stock prices. The authors used the data to examine the cross-section of US stock returns over the pre-CRSP period in their research.2 This focused on well-documented stock characteristics, namely beta, momentum (12-1 month price momentum), short-term reversal (1-month), size and value (dividend yield).

Active Quant: finding alpha with confidence
Blending data-driven insights, risk control and quant expertise to pursue reliable returns.
Evidence of equity factor premiums pre-1926
The analysis started with Fama-MacBeth regressions3 and univariate portfolio sorts on the dataset. The authors found that market beta was not priced and the capital asset pricing model (CAPM) largely failed to explain asset prices, as low-beta stocks generated positive alpha and high-beta stocks delivered negative alpha. Furthermore, momentum and value exhibited significant premiums and return spreads. By contrast, size failed to do so on both counts, while short-term reversal displayed a significant premium but yielded an insignificant return spread.
The authors then built market-neutral and size-neutral factor portfolios, by double-sorting on size and a specific factor characteristic. They observed economically substantial and statistically significant premiums and CAPM alphas for low-risk (beta), momentum and value (dividend yield), while the size premium was again insignificant for both measures. In terms of short-term reversal, they saw significant premiums but insignificant CAPM alphas. The main results are summarized in Figures 1 and 2.
Figure 1 | Return spread (%), for the periods 1866 to 1926 and 1927 to 2019
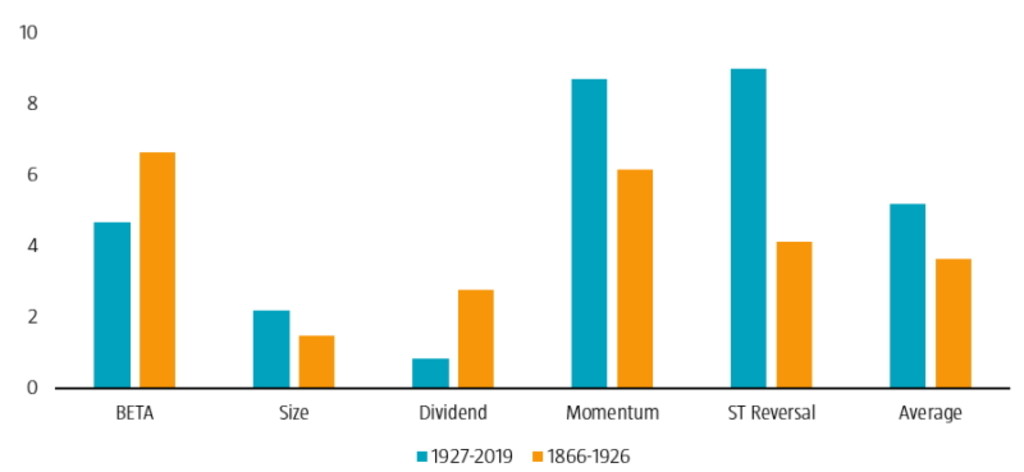
Source: Robeco Quantitative Research. The figure shows the average annualized CAPM alphas for the size, value, momentum, short-term reversal and beta factors for the pre-CRSP and CRSP samples. Factors are constructed from top-bottom portfolios from 2x3 size-characteristic-based portfolios. The pre-CRSP sample starts in January 1866 and ends December 1926. The CRSP sample runs between January 1927 and December 2019. Performance is measured on a monthly frequency.
Figure 2 | CAPM alpha (%), for the periods 1866 to 1926 and 1927 to 2019
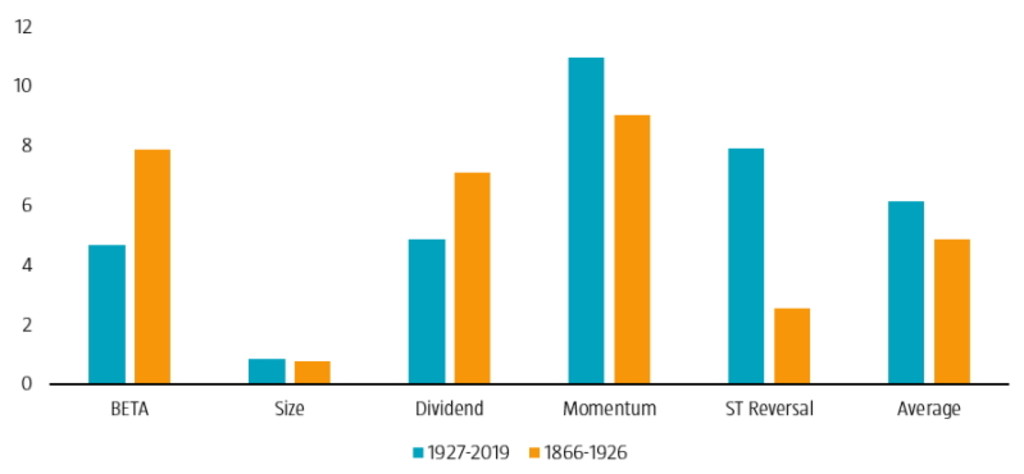
Overall, there was no material out-of-sample decay in factor premiums, as they were broadly similar in both the pre-1926 and post-1926 eras. The authors also confirmed that these results were generally robust over time, while different testing choices held up across industries and exchanges. Moreover, factor spanning tests revealed that low-risk, momentum, short-term reversal and value are non-redundant asset pricing factors, while size is subsumed by other factors. This indicates that low-risk, momentum and value are durable asset pricing factors.
Overall, there was no material out-of-sample decay in factor premiums, as they were broadly similar in both the pre-1926 and post-1926 eras. The authors also confirmed that these results were generally robust over time, while different testing choices held up across industries and exchanges. Moreover, factor spanning tests revealed that low-risk, momentum, short-term reversal and value are non-redundant asset pricing factors, while size is subsumed by other factors. This indicates that low-risk, momentum and value are durable asset pricing factors.
Machine learning techniques offer valuable insight on stock returns
The authors also conducted an out-of-sample test of machine learning (ML) methods, that had previously been successfully applied in the asset pricing literature. For example, some researchers4have argued that cross-sectional regressions and portfolio sorts can miss important dynamics and interactions between variables, such as return volatility and price momentum. These researchers found that ML models (random forests and neural networks that allow for nonlinear predictor interactions) could predict cross-sectional differences in stock returns over the period 1957 to 2016.
However, this sample period coincides with the CRSP era. And ultimately, ML models also require out-of-sample testing in independent samples, similar to traditional factor tests. The authors therefore applied the most promising ML techniques (random forest and neural network models) to the new 61-year sample period. They noted that the ML methods also worked in the pre-CRSP stage, as both models delivered significant CAPM alphas. As such, the research outlines that ML tools offer valuable information in terms of understanding the cross-section of stock returns.
In conclusion, this deep historical research underlines that factor premiums are not very dependent on specific market regimes, nor specific market structures. Instead, they are probably an ‘eternal’ feature of financial markets.
Footnotes
1 See: Harvey, C. R., July 2017, “Presidential address: the scientific outlook in financial economics”, Journal of Finance.
2 See: Baltussen, G., Van Vliet, B. P., and Van Vliet, P., November 2021, “The cross-section of stock returns before 1926 (and beyond)”, working paper.
3 See: Fama, E. F., and MacBeth, J. D., June 1973, “Risk, return, and equilibrium: empirical tests”, Journal of Political Economy.
4 See: Gu, S., Kelly, B., and Xiu, D., February 2020, “Empirical asset pricing via machine learning”, The Review of Financial Studies.
重要資料
本網站僅供《證券及期貨條例》(香港法例第571章)及其附屬法例所界定之專業投資者瀏覽及使用。 投資涉及風險。過往表現並不代表未來表現。本網站所載資料僅供參考之用,並不構成任何投資建議,亦非作出買賣任何證券或採納任何投資策略之要約或招攬。投資者不應僅憑本網站提供之資料作出投資決定,在作出任何投資決定前,應徵詢獨立意見(包括有關稅務影響之意見)。投資者應確保完全理解投資產品的相關風險,亦應考量自身投資目標及風險承受水平。投資乃閣下之個人決定。除非銷售投資產品的中介人已向閣下告知該投資產品適合閣下,並已解釋其符合閣下投資目標之原因,否則閣下不應投資。請參閱相關發售文件或其他法律文件,以獲取包括風險因素在內的進一步詳情。 本網站由荷寶投資管理香港有限公司發布,該公司受香港證券及期貨事務監察委員會(「證監會」)規管(中央編號:APU851)。本網站未經證監會審閱。 無法保證任何投資產品可實現其投資目標。概不就任何投資產品之表現或投資回報作任何聲明或承諾。投資的價值或會波動。本網站所載過往表現、推算或預測,均不應視作未來表現之保證或指標,且概不提供任何明示或暗示之保證。本網站內容建基於相信為可靠之來源,惟因應資料傳遞技術特性及須採用多項數據來源(包括第三方內容),故概不保證其準確性。所述觀點僅乃截至上述日期,或會隨市況變化而改變,可予更改而毋須另行通知。該等意見可能有別於其他荷寶投資專業人士之意見。因使用本材料或當中所載任何評論、意見或估算而引致之直接、間接或相應損失,荷寶概不承擔法律責任。荷寶並無責任更新本網站或任何網站內容。未經荷寶事先書面許可,不得複製、分發或刊發本網站任何材料。 除非另有說明,資料來源:荷寶。