Portfolio Manager


• Visione
Al di là dei tre grandi: un quadro del rialzo dei titoli hardware legati all'IA in Asia
In un nuovo documento redatto dai team azionari di Robeco che si occupano di investimenti quantitativi e fondamentali nei mercati emergenti, facciamo luce sul più ampio ecosistema tecnologico di Taiwan e Corea approfondendo dieci fasi chiave della catena del valore dell’infrastruttura per l’IA. Sullo sfondo del fenomenale rally dei titoli hardware asiatici, illustriamo come le nostre strategie quantitative e fondamentali stiano affrontando l’attuale boom tecnologico, nonché le opportunità e i rischi che ne derivano.
Relatori


Client Portfolio Manager
Sommario
- Il rialzo legato all’IA ha interessato principalmente titoli dei mercati emergenti, al di là del colosso TSMC , che domina l’indice
- I titoli hardware nei mercati emergenti possono essere classificati lungo dieci fasi della catena del valore dell’IA
- Le strategie incentrate sui mercati emergenti di Robeco coniugano performance ed esposizione bilanciata
Oggi, circa il 30% dell’indice MSCI EM è riconducibile a soli tre titoli: TSMC1 (peso in indice 14,5%; capitalizzazione di mercato 1.970 miliardi di dollari), Samsung Electronics (9,3%; 1.300 miliardi di dollari) e SK Hynix (6,8%; 1.100 miliardi di dollari), in aumento rispetto a un peso complessivo in indice del 12% appena tre anni fa. L’elevato peso di TSMC nell’indice pone un dilemma per i fondi attivi sui mercati emergenti regolamentati secondo la direttiva UCITS, in cui l’esposizione a un singolo titolo è in genere limitata al 10%, da cui ne deriva una posizione strutturalmente sottopesata sul colosso dei semiconduttori.
Oltre a TSMC, centinaia di società tecnologiche specializzate di Taiwan e Corea hanno registrato impressionanti rialzi dei prezzi delle azioni. La Figura 1 mostra i rendimenti da inizio anno dei titoli tecnologici taiwanesi e coreani nel nostro universo investibile. Per chi effettua una selezione attiva dei titoli, l’universo delle opportunità va ben oltre i vincitori più evidenti; tuttavia, le caratteristiche di queste società sono estremamente eterogenee, in quanto operano su segmenti diversi della catena del valore dell’IA, ognuno con proprie dinamiche di domanda e offerta e uno specifico panorama competitivo, che si traducono in profili di redditività e valutazione distinti. Sebbene le opportunità abbondino, dopo un rally così poderoso gli investitori devono mantenere disciplina in termini di fondamentali, valutazioni e aspettative sugli utili.
Figura 1 - Rendimenti 2026 dei titoli tecnologici taiwanesi e coreani nel nostro universo ME
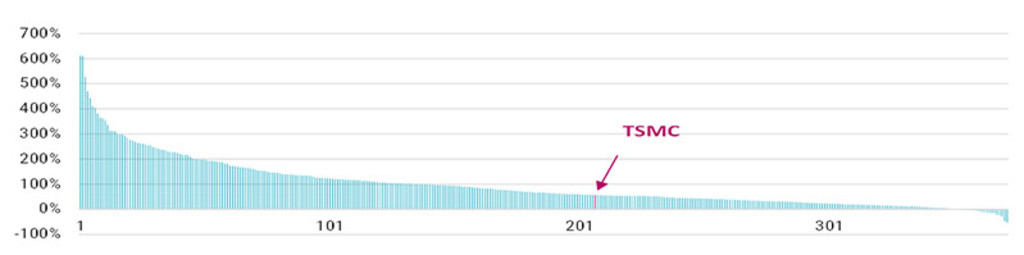
I rendimenti passati non sono indicativi dei possibili risultati futuri. Il valore degli investimenti può subire oscillazioni. TSMC e tutte le altre società citate nei grafici di questo articolo sono riportate esclusivamente a scopo illustrativo. Non è possibile trarre alcuna conclusione sullo sviluppo futuro della società. La loro menzione non costituisce una raccomandazione all’acquisto, alla vendita o al mantenimento.
Fonte: Bloomberg, Robeco. Dati aggiornati al 10 giugno 2026. Rendimenti azionari totali in valuta locale dei titoli tecnologici taiwanesi e coreani nel nostro universo attivo ME.
Per mappare il vasto ecosistema hardware asiatico e i rendimenti fenomenali generati da molti di questi titoli, che in numerosi casi hanno portato a valutazioni molto elevate, partiamo dalla classificazione di dieci fasi della catena del valore dell’infrastruttura per l’IA, dalla progettazione dei chip alla costruzione dei server. La Figura 2 illustra e spiega le dieci fasi che abbiamo individuato2. In questa sede, ci concentriamo sui titoli taiwanesi e coreani, data la predominanza delle società taiwanesi nell’attuale boom dell’infrastruttura per l’IA.3
Figura 2 – Le dieci fasi della catena del valore dell’IA
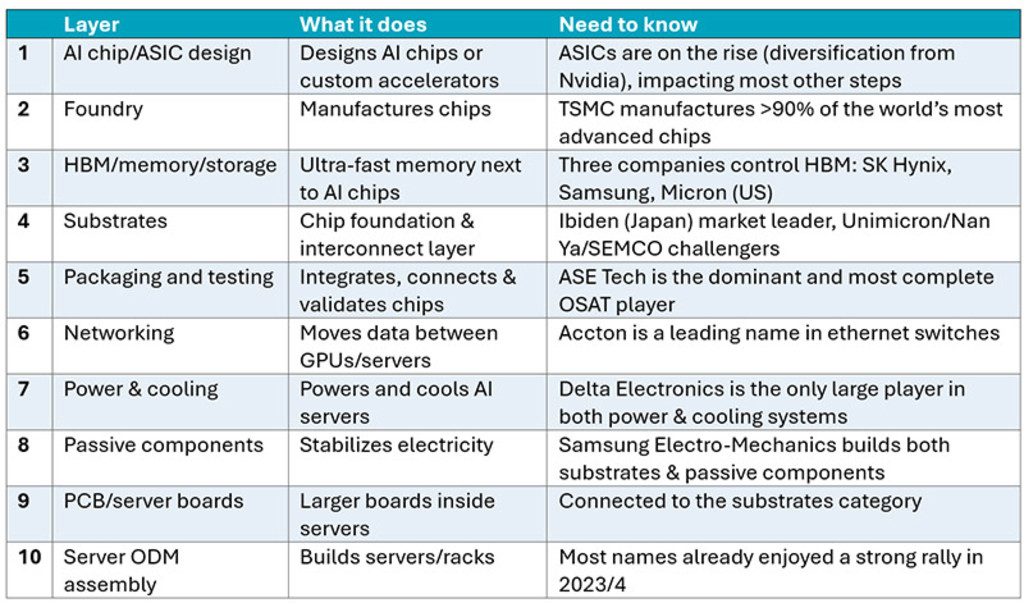
Fonte: Robeco
La Figura 3 mostra la capitalizzazione di mercato, i rendimenti e le valutazioni dei principali titoli di ciascuna categoria. Il rally dell’IA è stato di vasta portata, sebbene la dispersione dei rendimenti sia stata elevata, anche considerando quelli a cinque anni illustrati di seguito.
Figura 3 – Le principali società taiwanesi e coreane per fase della catena del valore dell’IA
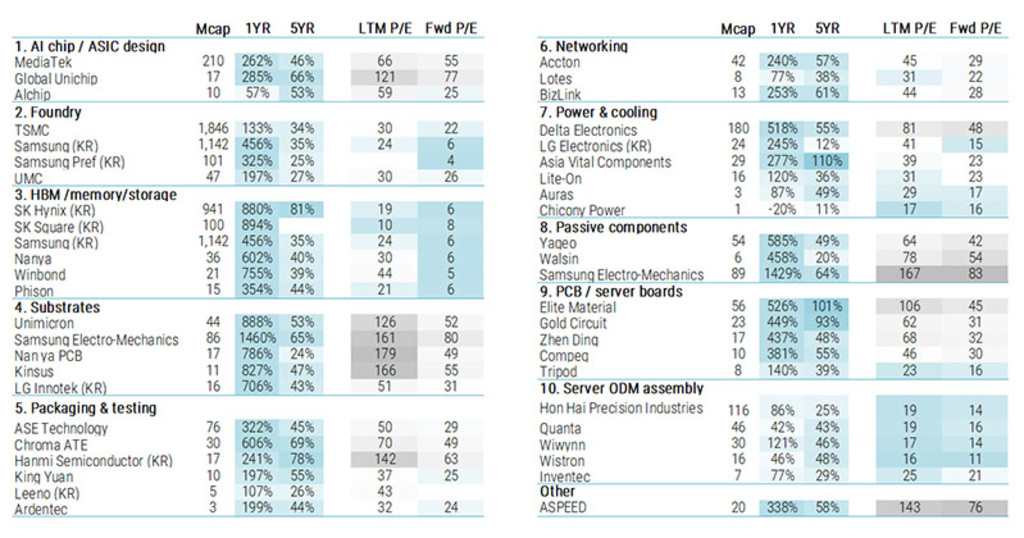
Nota: La carenza di chip di memoria è ormai ben documentata, ma anche componenti meno visibili come i substrati, i componenti passivi e le schede server dovrebbero continuare a rappresentare veri e propri colli di bottiglia nell’espansione dei server e dei data center destinati all’IA. Il rialzo ha determinato notevoli differenze di valutazione, anche confrontando il rapporto P/E storico con quello prospettico. Molti titoli ora sono scambiati a multipli prezzo/utili prospettici elevati, da cui si evince che il mercato si attende una crescita esplosiva degli utili.
I rendimenti passati non sono indicativi dei possibili risultati futuri. Il valore degli investimenti può subire oscillazioni. Le società mostrate in questo grafico sono riportate a solo scopo illustrativo. Non è possibile trarre alcuna conclusione sullo sviluppo futuro della società. La loro menzione non costituisce una raccomandazione all’acquisto, alla vendita o al mantenimento.
Fonte: Analisi di Robeco; Bloomberg. “Mcap” = capitalizzazione di mercato in milioni di dollari USA al 5 giugno 2026. Rendimenti al 10 giugno 2026.
L’attuale mercato rialzista dei titoli hardware asiatici in una prospettiva quinquennale
Come recita il detto, un’immagine vale più di mille parole. La Figura 4 illustra l’andamento quinquennale dei prezzi azionari dei tre titoli di maggior capitalizzazione in ciascuna categoria e mette in evidenza l’ampiezza del rally tecnologico asiatico. Tuttavia, la performance è variata in misura significativa tra i diversi segmenti: nella categoria PCB/schede server, alcuni titoli sono saliti di oltre venti volte negli ultimi cinque anni, mentre i produttori ODM di server hanno messo a segno rialzi notevoli, compresi tra il 300% e il 700%. Anche la tempistica del rally è stata eterogenea: gli assemblatori di server come Quanta e Wiwynn, ad esempio, hanno realizzato la maggior parte dei loro guadagni prima del 2026, in anticipo rispetto a molti altri beneficiari della costruzione dell’infrastruttura per l’IA.
Figura 4 – Rendimenti indicizzati a cinque anni dei primi tre player in ciascuna delle dieci categorie
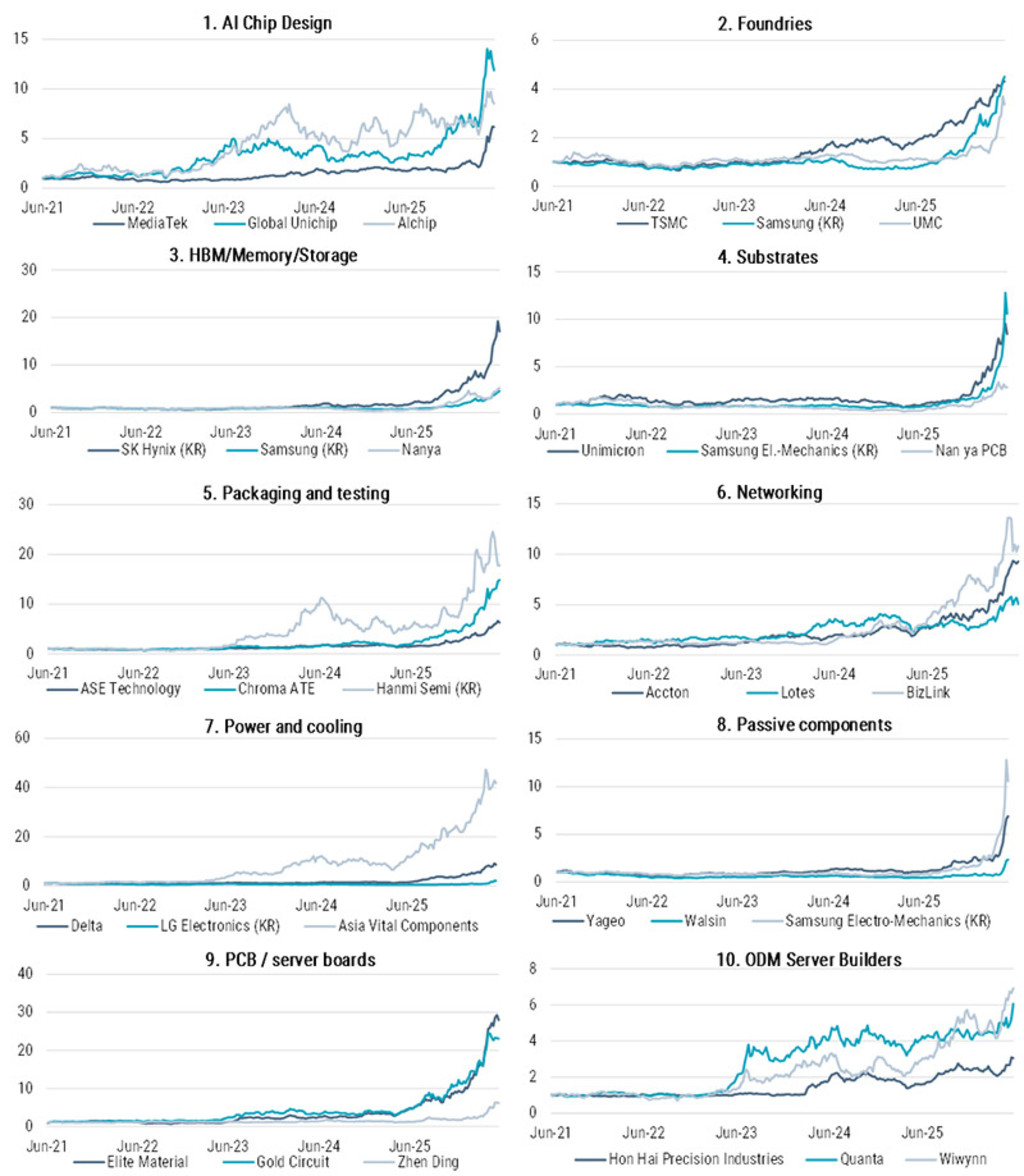
Fonte: Robeco, Bloomberg. Rendimenti indicizzati a cinque anni al 10 giugno 2026.
Outlook
Il rally tecnologico asiatico si avvicina a un punto di svolta in cui i fattori strutturali e la disciplina di mercato iniziano a prevalere sulla narrativa. I colli di bottiglia sono reali e persistenti: le limitazioni nel packaging avanzato (in particolare la tecnologia CoWoS), nei substrati specializzati e nei sistemi di raffreddamento termico restano vincolanti, ancorando di fatto l’offerta mentre gli investimenti in conto capitale degli hyperscaler continuano ad aumentare: tutto ciò sostiene il potere di determinazione dei prezzi e offre una chiara visibilità sugli utili in questi segmenti hardware midstream.
Quello che sta cambiando, tuttavia, è il comportamento del mercato: la prima fase del rally è stata ampia e trainata dal momentum, ma la prossima sarà probabilmente molto più selettiva. Poiché le valutazioni scontano un’esecuzione quasi perfetta, in particolare nel settore dell’hardware taiwanese, la dispersione è destinata ad aumentare in modo significativo. L’alfa sarà determinato dalla qualità: le società con capacità di generare flussi di cassa durevoli, bilanci solidi e buon potere di determinazione dei prezzi per assorbire l’aumento dei costi di input e l’intensità di capitale.
Al contempo, la filiera tecnologica globale sta diventando più frammentata: pur restando Taiwan e Corea centrali per l’infrastruttura IA più avanzata, in particolare nella fase di addestramento, la Cina sta costruendo rapidamente un ecosistema parallelo che è sempre più autosufficiente. Man mano che il settore si sposta verso l’inferenza, le architetture localizzate e gli ASIC personalizzati stanno guadagnando terreno, mentre gli operatori cinesi a valle stanno costruendo un contrappeso competitivo rilevante dal punto di vista strutturale.
In questo contesto, l’esposizione passiva è sempre sempre più limitata, sia dalla concentrazione degli indici che dai vincoli normativi. Un approccio più efficace è intrinsecamente attivo: combina segnali sistematici, come revisioni degli utili e momentum, con una supervisione basata sui fondamentali per orientarsi tra geopolitica, dinamiche della supply chain e complessità aziendale, consentendo in tal modo un posizionamento disciplinato, inclusa una rotazione selettiva dalle esposizioni taiwanesi più tirate verso titoli coreani o regionali di alta qualità in cui le valutazioni offrono un margine di sicurezza più interessante.
Leggi gli ultimi approfondimenti
Iscriviti alla nostra newsletter per ricevere aggiornamenti sugli investimenti e le analisi dei nostri esperti.
Conclusioni
Sebbene sia le nostre strategie quantitative che quelle fondamentali mantengano un’esposizione prevalentemente neutra al settore hardware asiatico, entrambi gli stili hanno continuato a generare risultati solidi durante tutto il rally guidato dall’intelligenza artificiale, grazie a un’allocazione attiva per Paese e/o a una selezione dei titoli bottom-up di successo. Ciò dimostra che la performance non dipende da un unico trend tecnologico, ma è determinata dalla capacità di identificare opportunità nell’intero universo dei mercati emergenti.
Perseguiamo questa opportunità in modi diversi, ma complementari. Le nostre strategie quantitative sui mercati emergenti si concentrano sulla selezione dei titoli bottom-up e basata su regole attraverso centinaia di piccole posizioni attive, mentre le nostre strategie fondamentali sui mercati emergenti combinano l’analisi top-down dei paesi con una selezione dei titoli ad alta convinzione. Grazie a una cultura di stretta collaborazione, valorizziamo i punti di forza di ciascun team, rendendo Robeco una piattaforma di investimento leader nei mercati emergenti con una lunga e comprovata esperienza nel creare valore in un’ampia gamma di contesti di mercato.
Note in calce
1TSMC e tutte le altre società citate in questo articolo sono riportate esclusivamente a scopo illustrativo. Non è possibile trarre alcuna conclusione sullo sviluppo futuro della società. La loro menzione non costituisce una raccomandazione all’acquisto, alla vendita o al mantenimento.
2È superfluo sottolineare che questo è solo uno dei possibili framework per comprendere la catena del valore relativa all’IA, che in realtà è un ecosistema vasto, complesso e fortemente interconnesso.
3Molte di queste società si trovano ad affrontare la concorrenza, perlopiù rappresentata da società americane, giapponesi e cinesi.