Robeco logo

Disclaimer

1. General
Please read this information carefully.

This website is prepared and issued by Robeco Hong Kong Limited ("Robeco"), which is a corporation licensed by the Securities and Futures Commission in Hong Kong to engage in Type 1 (dealing in securities); Type 2 (dealing in futures contracts); Type 4 (advising in securities) and Type 9 (asset management) regulated activities. The Company does not hold client assets and is subject to the licensing condition that it shall seek the SFC’s prior approval before extending services at retail level. This website has not been reviewed by the Securities and Futures Commission or any regulatory authority in Hong Kong.

2. Important risk disclosures
Important risk disclosures Robeco Capital Growth Funds (“the Funds”) are distinguished by their respective specific investment policies or any other specific features. Please read carefully for the risks of the Funds:

  • Some Funds are subject to investment, market, equities, liquidity, counterparty, securities lending and foreign currency risk and risk associated with investments in small and/or mid-capped companies.

  • Some Funds are subject to the risks of investing in emerging markets which include political, economic, legal, regulatory, market, settlement, execution, counterparty and currency risks.

  • Some Funds may invest in China A shares directly through the Qualified Foreign Institutional Investor (“QFII”) scheme and / or RMB Qualified Foreign Institutional Investor (“RQFII”) scheme and / or Stock Connect programmes which may entail additional clearing and settlement, regulatory, operational, counterparty and liquidity risk.

  • For distributing share classes, some Funds may pay out dividend distributions out of capital. Where distributions are paid out of capital, this amounts to a return or withdrawal of part of your original investment or capital gains attributable to that and may result in an immediate decrease in the net asset value of shares.

  • Some Funds’ investments maybe concentrated in one region / one country / one sector / around one theme and therefore the value of the Fund may be more volatile and may be subject to concentration risk.

  • The risk exists that the quantitative techniques used by some Funds may not work and the Funds’ value may be adversely affected.

  • In addition to investment, market, liquidity, counterparty, securities lending, (reverse) repurchase agreements and foreign currency risk, some Funds are subject to risk associated with fixed income investments like credit risk, interest rate risk, convertible bonds risk, ABS risk and the risk of investments in non-investment grade or unrated securities and the risk of investments made in non-investment grade sovereign securities.

  • Some Funds can use derivatives extensively. Robeco Global Consumer Trends Equities can use derivatives for hedging and efficient portfolio management. Derivatives exposure may involve higher counterparty, liquidity and valuation risks. In adverse situations, the Funds may suffer significant losses (even a total loss of the Funds’ assets) from its derivative usage.

  • Robeco European High Yield Bonds is subject to Eurozone risk.

  • Investors may suffer substantial losses of their investments in the Funds. Investor should not invest in the Funds solely based on the information provided in this document and should read the offering documents (including potential risks involved) for details.

3. Local legal and sales restrictions
The Website is to be accessed by “professional investors” only (as defined in the Securities and Futures Ordinance (Cap.571) and/or the Securities and Futures (Professional Investors) Rules (Cap.571D) under the laws of Hong Kong). The Website is not directed at any person in any jurisdiction where (by reason of that person’s nationality, residence or otherwise) the publication or availability of the Website is prohibited. Persons in respect of whom such prohibitions apply or persons other than those specified above must not access this Website. Persons accessing the Website need to be aware that they are responsible themselves for the compliance with all local rules and regulations. By accessing this Website and any of its pages, you acknowledge your agreement with understanding of the following terms of use and legal information. If you do not agree to the terms and conditions below, do not access this Website or any pages thereof.

The information contained in the Website is being provided for information purposes.

Neither information nor any opinion expressed on the Website constitutes a solicitation, an offer or a recommendation to buy, sell or dispose of any investment, to engage in any other transaction or to provide any investment advice or service. The information contained in the Website does not constitute investment advice or a recommendation and was prepared without regard to the specific objectives, financial situation or needs of any particular person who may receive it. An investment in a Robeco product should only be made after reading the related legal documents such as management regulations, prospectuses, most recent annual and semi-annual reports, which can be all be obtained free of charge at www.robeco.com/hk/en and at the Robeco Hong Kong office.

4. Use of the Website
The information is based on certain assumptions, information and conditions applicable at a certain time and may be subject to change at any time without notice. Robeco aims to provide accurate, complete and up-to-date information, obtained from sources of information believed to be reliable. Persons accessing the Website are responsible for their choice and use of the information.

5. Investment performance
No assurance can be given that the investment objective of any investment products will be achieved. No representation or promise as to the performance of any investment products or the return on an investment is made. The value of your investments may fluctuate. The value of the assets of Robeco investment products may also fluctuate as a result of the investment policy and/or the developments on the financial markets. Results obtained in the past are no guarantee for the future. Past performance, projection, or forecast included in this Website should not be taken as an indication or guarantee of future performance, and no representation or warranty, express or implied, is made regarding future performance. Fund performance figures are based on the month-end trading prices and are calculated on a total return basis with dividends reinvested. Return figures versus the benchmark show the investment management result before management and/or performance fees; the fund returns are with dividends reinvested and based on net asset values with prices and exchange rates of the valuation moment of the benchmark.

Investments involve risks. Past performance is not a guide to future performance. Potential investors should read the terms and conditions contained in the relevant offering documents and in particular the investment policies and the risk factors before any investment decision is made. Investors should ensure they fully understand the risks associated with the fund and should also consider their own investment objective and risk tolerance level. Investors are reminded that the value and income (if any) from shares of the fund may be volatile and could change substantially within a short period of time, and investors may not get back the amount they have invested in the fund. If in doubt, please seek independent financial and professional advice.

6. Third party websites
This website includes material from third parties or links to websites maintained by third parties some of which is supplied by companies that are not affiliated to Robeco. Following links to any other off-site pages or websites of third parties shall be at the own risk of the person following such link. Robeco has not reviewed any of the websites linked to or referred to by the Website and does not endorse or accept any responsibility for their content nor the products, services or other items offered through them. Robeco shall have no liability for any losses or damages arising from the use of or reliance on the information contained on websites of third parties, including, without limitation, any loss of profit or any other direct or indirect damage. Third party off-site pages or websites are provided for informational purposes only.

7. Limitation of liability
Robeco as well as (possible) other suppliers of information to the Website accept no responsibility for the contents of the Website or the information or recommendations contained herein, which moreover may be changed without notice.

Robeco assumes no responsibility for ensuring, and makes no warranty, that the functioning of the Website will be uninterrupted or error-free. Robeco assumes no responsibility for the consequences of e-mail messages regarding a Robeco (transaction) service, which either cannot be received or sent, are damaged, received or sent incorrectly, or not received or sent on time.

Neither will Robeco be liable for any loss or damage that may result from access to and use of the Website.

8. Intellectual property
All copyrights, patents, intellectual and other property, and licenses regarding the information on the Website are held and obtained by Robeco. These rights will not be passed to persons accessing this information.

9. Privacy
Robeco guarantees that the data of persons accessing the Website will be treated confidentially in accordance with prevailing data protection regulations. Such data will not be made available to third parties without the approval of the persons accessing the Website, unless Robeco is legally obliged to do so. Please find more details in our Privacy and Cookie Policy.

10. Applicable law
The Website shall be governed by and construed in accordance with the laws of Hong Kong. All disputes arising out of or in connection with the Website shall be submitted to the exclusive jurisdiction of the courts of Hong Kong.

Please click the “I agree” button if you have read and understood this page and agree to the Disclaimers above and the collection and use of your personal data by Robeco, for the purposes for which such data is collected and used as set out in the Privacy and Cookie Policy, including for the purpose of direct marketing of Robeco products or services. Otherwise, please click “I Disagree” to leave the website.

I Disagree

12-05-2021 · Insight

Spring has sprung for Value investing

Despite the recent rally in cheap stocks, we believe the Value upswing still has a way to go. Spreads in valuation multiples between growth and Value stocks remain high, while fundamentals and sentiment have improved in recent months for the latter. Thus, after a long and harsh ‘quant winter’, spring has sprung and Value seems ready for summer.

    Authors

  • Matthias Hanauer - Researcher

    Matthias Hanauer

    Researcher

  • Sebastian Schneider - Researcher

    Sebastian Schneider

    Researcher

Summary

  1. Despite the recent Value rally, spreads in valuation multiples remain wide

  2. Fundamentals and growth forecasts contradict the 'cheap for a reason' tag

  3. Market sentiment is becoming a tailwind for Value stocks

The long-awaited value comeback was triggered by the announcement of successful Pfizer-BioNTech Covid-19 vaccine candidate results on 9 November 2020. This culminated in strong returns for the value factor in the first quarter of 2021. Despite this rally, the spread in valuation multiples between expensive and cheap stocks remains at exceptionally high levels. Indeed, Figure 1 shows that the gap has surpassed levels last seen at the height of the tech bubble in the late 1990s, based on an enhanced value factor.1

Figure 1 | Composite valuation spread for the enhanced value strategy

Figure 1 | Composite valuation spread for the enhanced value strategy

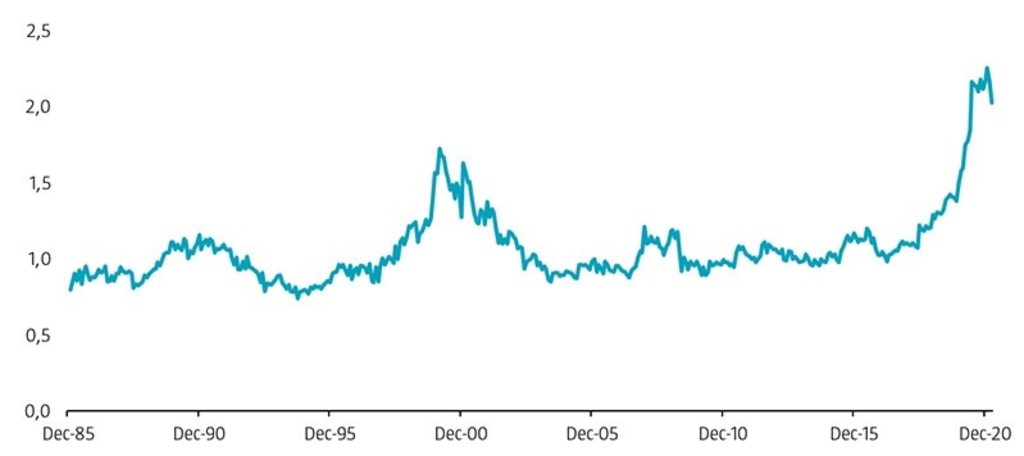
Source: Refinitiv. The figure shows the composite valuation spread between the top and bottom quintile portfolios of the enhanced value strategy. The investment universe consists of constituents of the MSCI Developed and Emerging Markets indices. Before 2001, we use the FTSE World Developed index for developed markets (going back to December 1985), and for emerging markets, the largest 800 constituents of the S&P Emerging BMI at the semi-annual index rebalance (going back to December 1995).

Value investing remains very attractive from a valuation perspective

In our view, this recent widening in multiples has several implications. First, diverging valuation multiples between cheap and expensive stocks are inconsistent with the concern that the value premium may have been arbitraged away as a result of it being so well known and due to substantial funds being invested in value strategies. Were this the case, it would be reflected in a narrowing valuation spread over time instead of the widening trend we have witnessed. Therefore, it is highly unlikely that arbitrage activity was the driver of the recent underperformance of value strategies.

Second, diverging valuation multiples suggest that return prospects for value are currently high. The widening of the valuation spread in the late 1990s was followed by mean reversion in the early 2000s, which resulted in the massive outperformance of cheap stocks over their expensive counterparts.

Third, the net spread widening that occurred over our full sample period means that realized returns might even underestimate the true magnitude of the value premium over this period.2

When we look at the recent developments in Figure 1, we do see that the value spread has shrunk slightly in 2021. However, it remains considerably wide compared to historical levels, still above the 97th percentile. Therefore, we believe that value investing remains very attractive from a valuation perspective.

The ‘cheap for a reason’ tag does not hold

One question that remains is that maybe ‘this time is indeed different’ and value stocks deserve to be cheaper than historically observed. Maybe expensive companies (based on simple valuation multiples) could be much more profitable today than in the past (compared to the dot-com bubble, for example), or their expected long-term growth could be much higher.

Figure 2 shows the spread in operating performance (proxied by gross profitability, GP/A)3 between cheap and expensive companies. On average, cheap stocks – according to the enhanced value strategy – display about the same levels of profitability as expensive ones, at a global level.4

Admittedly, cheap stocks have been less profitable between 2017 and 2020. However, their profitability has improved considerably in recent months. In fact, cheap stocks were actually slightly more profitable than their expensive peers at the end of March 2021. Therefore, the current valuation spread cannot be justified by differences in profitability.

Figure 2 | Spread in gross profitability for the enhanced value strategy

Figure 2 | Spread in gross profitability for the enhanced value strategy

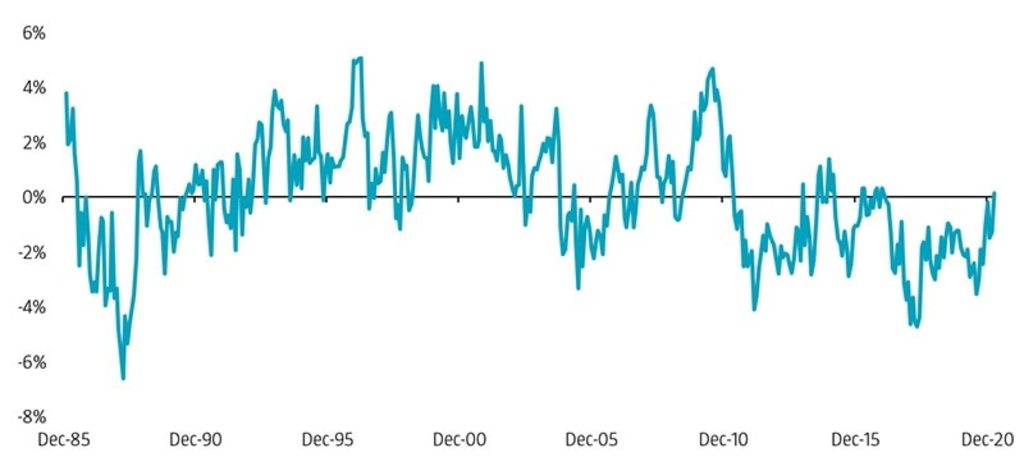
Source: Refinitiv. The figure shows the spread in gross profitability between the top and bottom quintile portfolios of an enhanced value strategy. The investment universe consists of constituents of the MSCI Developed and Emerging Markets indices. Before 2001, we use the FTSE World Developed index for developed markets (going back to December 1985), and for emerging markets, the largest 800 constituents of the S&P Emerging BMI at the semi-annual index rebalance (going back to December 1995).

Moreover, current profitability is mainly backward-looking, so what about future growth expectations? If profitability levels are the same as those in the present day, then stocks with higher expected growth should trade at higher valuations.

Cheap stocks tend to have lower future growth expectations than expensive ones, which explains why the latter are also called ‘growth stocks’. However, relative growth expectations are currently not lower than they have been in the previous 15 years, especially for developed markets. Thus, the widening of the value spread over the last three years cannot be traced back to a deterioration in growth expectations for value stocks.

Market sentiment for Value receives a shot in the arm

The recent value recovery has led to a change in sentiment regarding value stocks. Price momentum – measured as a stock’s return over the last 6 to 12 months – is one way to gauge market sentiment. While value and momentum tend to be negatively correlated – therefore providing diversification benefits – there have been a few periods in history when value stocks exhibited strong momentum. We expect this to happen again in the coming months.

Figure 3 depicts the difference between the median six-month performance of value and growth stocks. The difference has shifted from very negative to positive over the few last months. Since most momentum strategies use price momentum measures over 6 to 12 months and the value turnaround only started about six months ago, they have yet to purchase value stocks significantly. But one should expect them to start buying value stocks in a larger scale now that the market regime shift is clearly reflected in price momentum metrics.

Figure 3 | Spread in Momentum (6-0) for the enhanced value strategy

Figure 3 | Spread in Momentum (6-0) for the enhanced value strategy

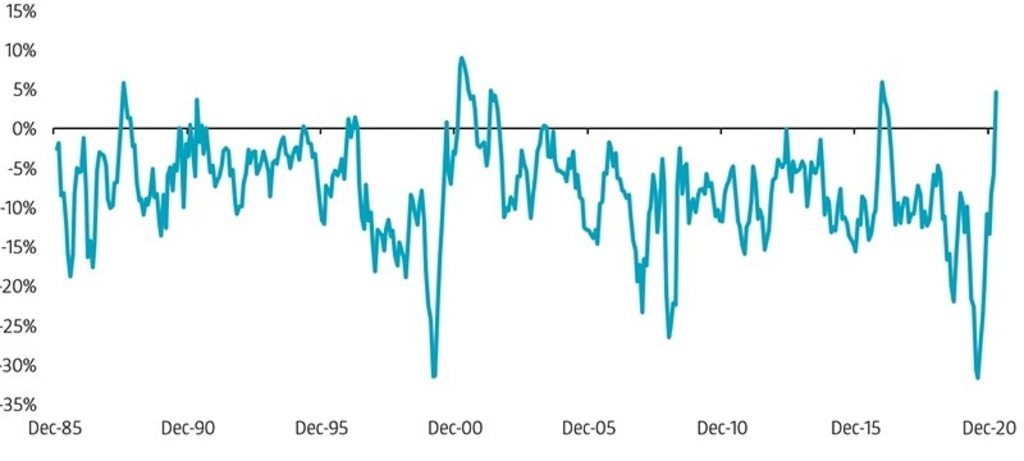
Source: Refinitiv. The figure shows the spread in 6-0 month price momentum between the top and bottom quintile portfolios of an enhanced value strategy. The investment universe consists of constituents of the MSCI Developed and Emerging Markets indices. Before 2001, we use the FTSE World Developed index for developed markets (going back to December 1985), and for emerging markets, the largest 800 constituents of the S&P Emerging BMI at the semi-annual index rebalance (going back to December 1995).

Current sentiment is in favor of value

Another way of measuring sentiment is to look at analyst earnings estimate revisions. Analysts tend to issue more upward than downward earnings revisions for expensive stocks than for cheap ones. However, over the last few months, analyst earnings per share (EPS) revisions for value stocks have been as optimistic as they have ever been in recent history. Although we still have to see if analyst earnings expectations will play out as forecasted, current sentiment is in favor of value.

All in all, after a long and harsh quant winter, spring has sprung and value seems ready for summer.

Read the full article


Footnotes

1 The enhanced value strategy is based on a composite of book-to-market (R&D adjusted), EBITDA/EV, CF/P, and NPY. Value stocks are sorted into quintile portfolios based on the valuation composite and in a region and sector respectively country neutral manner for developed and emerging markets. Quintile portfolios are equal-weighted and reformed monthly. The details of the enhanced value strategy are described in Blitz, D., and Hanauer, M., January 2021, “Resurrecting the Value Premium”, Journal of Portfolio Management.
2 Please see also the analysis in our paper ‘Resurrecting the Value Premium’.
3 GP/A is gross profit to assets.
4 The difference would be negative for a value strategy solely based on book-to-market. The difference is less pronounced or non-existent for the enhanced value strategy as it is based on a composite of value metrics that use profit measures such as EBITDA and cash flow in the numerator.

Discover the value of quant

Subscribe for cutting-edge quant strategies and insights.

Explore quant

Important information

The contents of this document have not been reviewed by the Securities and Futures Commission ("SFC") in Hong Kong. If you are in any doubt about any of the contents of this document, you should obtain independent professional advice. This document has been distributed by Robeco Hong Kong Limited (‘Robeco’). Robeco is regulated by the SFC in Hong Kong. This document has been prepared on a confidential basis solely for the recipient and is for information purposes only. Any reproduction or distribution of this documentation, in whole or in part, or the disclosure of its contents, without the prior written consent of Robeco, is prohibited. By accepting this documentation, the recipient agrees to the foregoing This document is intended to provide the reader with information on Robeco’s specific capabilities, but does not constitute a recommendation to buy or sell certain securities or investment products. Investment decisions should only be based on the relevant prospectus and on thorough financial, fiscal and legal advice. Please refer to the relevant offering documents for details including the risk factors before making any investment decisions. The contents of this document are based upon sources of information believed to be reliable. This document is not intended for distribution to or use by any person or entity in any jurisdiction or country where such distribution or use would be contrary to local law or regulation. Investment Involves risks. Historical returns are provided for illustrative purposes only and do not necessarily reflect Robeco’s expectations for the future. The value of your investments may fluctuate. Past performance is no indication of current or future performance.