Client Portfolio Manager
Discover emerging opportunities
For investors focused on long-term investing with real diversification, EM exposure is critical.






Allocating to one manager across developed and emerging markets can still provide meaningful diversification of active return.

Asset owners often allocate to multiple managers to diversify sources of active return. That logic is sound: if one manager underperforms, another may offset it, especially when their investment styles, processes, or opportunity sets differ.
But diversification doesn’t only exist between managers. It can also exist within a single manager, when a comparable investment philosophy is applied across different market universes.
This raises an important question around portfolio construction: if an investor allocates to the same manager in developed markets (DM) and emerging markets (EM), are they simply doubling up on the same source of alpha – or can they still achieve meaningful diversification?

For investors focused on long-term investing with real diversification, EM exposure is critical.
Our analysis suggests they can. Even when the same manager runs comparable strategies in both DM and EM, the alpha generated in those portfolios tends to be only weakly correlated. In other words, the same manager does not necessarily mean the same return pattern.
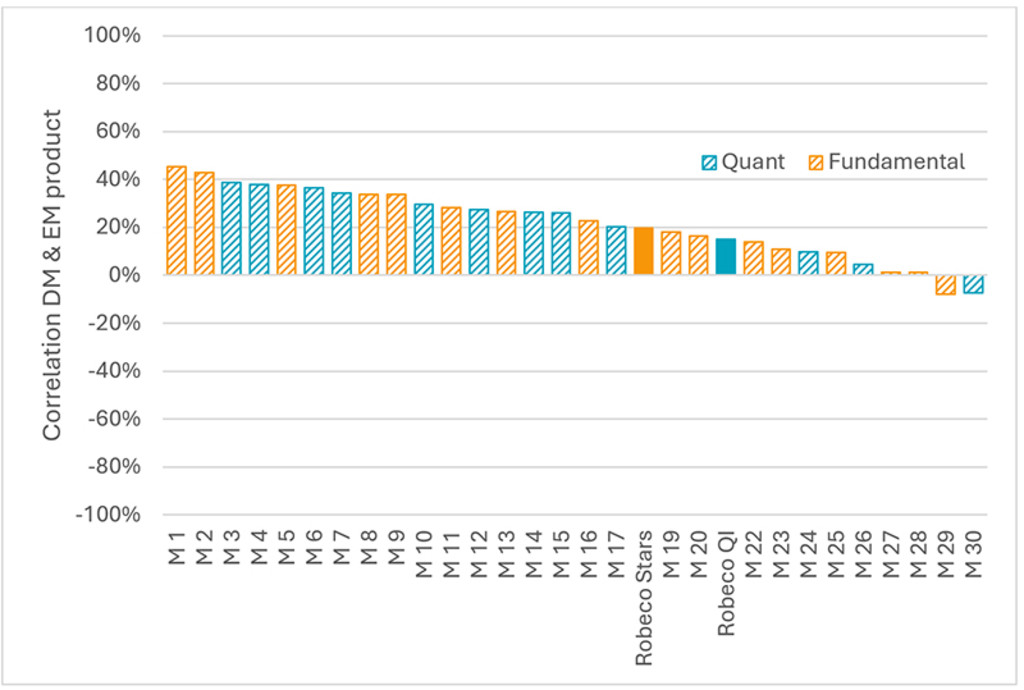
Using eVestment data, we examine whether comparable DM and EM strategies from the same asset manager deliver similar alpha. We analyze 30 managers, covering both quantitative strategies (e.g. Robeco QI DM Enhanced Indexing versus Robeco QI EM Enhanced Indexing) and fundamental strategies (e.g. Robeco Global Stars versus Robeco EM Stars). For each DM–EM pair, we compute the alpha correlation using the maximum available overlapping history between 2005 and 2025.



Our Active Quant strategy is designed to be highly effective by analyzing vast amounts of potential opportunities and exploiting market inefficiencies resulting from predictable patterns.
Past performance does not guarantee future results. The value of your investments may fluctuate.
Source: Robeco, eVestment, 2005-2025. For illustrative purposes only.
The results show that the average alpha correlation across managers is approximately 0.2, with correlations ranging from close to 0.0 to around 0.4. This indicates some commonality, but limited overlap in alpha generation. Importantly, the pattern is similar for both quant and fundamental managers.
That finding is intuitive once we consider the underlying opportunity sets. DM and EM equity markets differ materially in market structure, liquidity, sector composition, analyst coverage, governance regimes, and the way information is incorporated into prices. As a result, even when a manager applies a similar philosophy or research framework across both universes, the actual sources of excess return are often not the same.
For quant strategies, investment signals may remain conceptually consistent across markets, but their strength, persistence, and implementation can vary significantly. For fundamental strategies, company selection opportunities, market inefficiencies, and macro sensitivities also differ. The result is that active returns can follow meaningfully different paths across DM and EM, even under one investment house.
Low alpha correlation also suggests that periods of underperformance may not coincide. In practice, this means a manager’s DM and EM strategies may experience drawdowns at different times and for different reasons. For asset owners, that can help smooth the overall experience of active returns across a broader equity allocation.
This matters because many asset owners face a trade-off between diversification and complexity. Adding more managers can broaden return sources, but it can also increase governance burden, due diligence requirements, reporting complexity, and the risk of unintended inconsistencies across portfolios.
Allocating to one manager across multiple universes may offer a different route: operational simplicity without necessarily giving up diversification of alpha. Where relevant, this can also support greater consistency in portfolio design, e.g. in the treatment of sustainability preferences or climate objectives, while still allowing the active return profile to differ across markets.
This may be particularly relevant for asset owners considering broader global equity structures, including combinations of DM and EM within an overall ACWI-oriented allocation.
Even when the investment process and the manager are the same, DM and EM strategies tend to generate largely distinct alpha. Allocating across universes can therefore provide meaningful diversification, without the need to change managers or philosophies.
For asset owners, that means manager consolidation does not automatically imply return concentration. In some cases, a single manager relationship can offer a combination of diversified active return streams, implementation consistency, and lower operational complexity.
THIS WEBSITE IS SOLELY INTENDED FOR PROFESSIONAL INVESTORS, WHICH HAS THE MEANING ASCRIBED TO IT IN THE SECURITIES AND FUTURES ORDINANCE (CAP. 571 OF THE LAWS OF HONG KONG) AND ITS SUBSIDIARY LEGISLATION. Investment involves risks. Past performance is not indicative of future performance. The information contained in this website is provided for reference only and does not constitute investment advice or an offer or solicitation to buy or sell in any securities or to adopt any investment strategy. Investors should not base their investment decisions solely on the information provided on this website and are advised to seek independent advice (including advice on tax implications) before making any investment decisions. Investors should ensure they fully understand the risks associated with the investment products and should also consider their own investment objectives and risk tolerance level. The investment decision is yours. You should not invest unless the intermediary who sells you the investment products has advised you that it is suitable for you and has explained how it is consistent with your investment objectives. Please refer to the relevant offering documents or other legal documents for further details including the risk factors. This website is published by Robeco Hong Kong Limited which is regulated by the Hong Kong Securities and Futures Commission (“SFC”) (CE No. APU851). This website has not been reviewed by the SFC. No assurance can be given that the investment objective of any investment products will be achieved. No representation or promise as to the performance of any investment products or the return on an investment is made. The value of investments may fluctuate. Past performance, projections, or forecasts included in this website should not be regarded as guarantees or indications of future performance, and no express or implied warranty is provided. The contents of this website are based on sources believed to be reliable, but due to the nature of information delivery technology and the necessity of using multiple data sources, including third party content, their accuracy is not guaranteed. The opinions expressed are as of the date shown above and may change as market conditions evolve, and are subject to change without notice. These opinions may differ from those of other Robeco investment professionals. Robeco accepts no liability for any direct, indirect, or consequential loss arising from the use of this material or any comments, opinions, or estimates contained herein. Robeco has no duty to update this website or any website content. Materials on this website may not be reproduced, distributed, or published without prior written permission from Robeco. Unless otherwise specified, Source: Robeco.
Warning – Fraudulent use of Robeco on websites and social media Read more