Portfolio Manager
Get the latest insights
Subscribe to our newsletter for investment updates and expert analysis.






The valuation gap between Asia-Pacific and the US has narrowed, but we believe the trend is nascent. We believe this makes Asia-Pacific equities an appropriate allocation for investors seeking diversification from concentrated US exposure.


For investors seeking long-term diversification from an overweight position in the US, Asia-Pacific equities have a compelling investment thesis. The combination of macroeconomic strength, a broad sector mix, and long‑term structural drivers is starting to be recognized, with the region outperforming through 2025 and 2026.
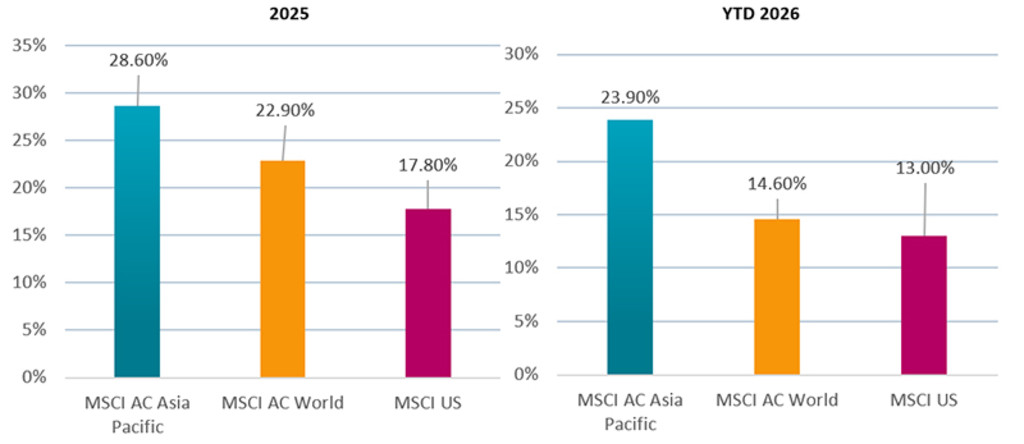
Past performance is no guarantee of future results. The value of your investments may fluctuate.
Source: MSCI, full year 2025 (left-hand chart), year to 31 August 2026 (right-hand chart). USD gross return
Shareholder-friendly governance reforms in markets such as Japan and Korea are improving return profiles, while India and ASEAN benefit from strong domestic demand and the multiplier effects of infrastructure and supply‑chain investment. The region also underpins global AI and energy transition manufacturing, supported by a solid spine of materials extraction and processing running through Australia, Indonesia and China.
Valuations provide a second important pillar for the Asia-Pacific investment thesis (see Figure 2). Earnings revisions across Asia-Pacific are turning positive, supported by corporate reforms, strengthening domestic demand and later cycle benefits from AI, infrastructure build-outs and higher defense spending. Dividend yields have also historically been more attractive in Asia, giving investors an additional component of total return.
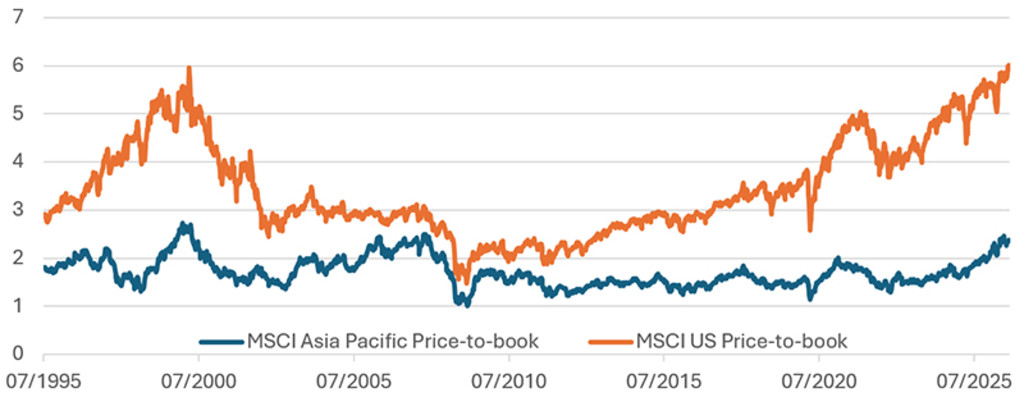
Past performance is no guarantee of future results. The value of your investments may fluctuate.
Source: Robeco, MSCI, 31 August 2026.
Subscribe to our newsletter for investment updates and expert analysis.
Asia ex-Japan remains a common institutional building block for allocating to the region, reflecting a long-standing practice of treating Japan as a separate allocation because of its large, liquid equity market and distinct economic profile. The MSCI AC Asia ex-Japan Index (USD gross return, 31 August 2026) is concentrated in North Asia: Taiwan represents 30.7%, Korea 23.3% and China 23.0%, so roughly three-quarters of the index is allocated to those three markets. By contrast, the MSCI AC Asia-Pacific Index (USD gross return, 31 August 2026) incorporates Japan and Australia alongside Asian emerging markets: Japan accounts for 29.6%, Taiwan 18.9%, Korea 14.4%, China 14.2%, Australia 8.4% and India 7.8%. The balance is spread across Hong Kong, Singapore, ASEAN markets
and New Zealand, resulting in a broader country mix.
The indices also differ materially in sector composition and historical risk characteristics. Information technology represents 46.4% of Asia ex-Japan, compared with 33.9% of the broader Asia-Pacific index, reflecting Asia ex-Japan’s greater exposure to Taiwanese and Korean technology and semiconductor companies. That distinction may be relevant for investors assessing aggregate exposure to the global technology cycle, including alongside US equity holdings. The MSCI AC Asia-Pacific Index recorded annualized volatility more than two percentage points lower than the MSCI AC Asia ex-Japan Index over the three-, five- and ten-year periods, while its maximum drawdown was 7.77 percentage points smaller. These are historical differences rather than indications of future risk or return, and the appropriate benchmark depends on whether Japan and Australia are intended to sit within, or alongside, an investor’s Asia allocation.

Past performance is no guarantee of future results. The value of your investments may fluctuate.
Source: MSCI AC Asia-Pacific Index and MSCI AC Asia ex-Japan Index factsheets, 31 August 2026. Calculations are based on monthly gross USD returns.
Broad Asia-Pacific works as a diversifier for some investors because it blends developed and emerging exposure with genuinely different return drivers.
Japan’s domestic corporate governance reforms have helped re-rate Japan’s stock market in the past 2 years, but there is significant progress still to make. Pressure on sub-book-value companies has produced four consecutive record years of buybacks, with fiscal 2026 projected to surpass USD 100 billion1 and Corporate Governance Code reforms now pushing remuneration and capital-efficiency disclosures. Japan’s market breadth and depth have provided a great hunting ground for alpha opportunities, so our Asia-Pacific Equities strategy has consistently held an overweight position in Japan. Despite JPY weakness in the first half of 2026, our view remains that firmer inflation and ongoing policy normalization in Japan are supportive of a more balanced currency and interest-rate environment over time.
To complement North Asia’s dominance in industry and tech, Australia brings resources, financials and high-payout defensives: iron ore, copper, gold and lithium exposure that is tied to the commodity and energy-transition cycle, rather than purely tech, plus a governance culture that caters to long-term institutional investors.
Asia-Pacific’s emerging-market growth engine is not lost in the process. India's domestic consumption story, ASEAN's manufacturing relocation beneficiaries and Korea and Taiwan's technology leadership all remain present, simply at lower weights.
Asia-Pacific encompasses economies at very different stages of development, with varied growth rates, income levels, industry structures, cultures and currencies, creating a complex landscape rich in potential alpha. In such a diverse and heterogeneous region, we believe active management is advantageous.
Within the Asia-Pacific equities universe, we continue to identify companies whose share prices do not reflect their true potential. We seek to avoid overvalued growth stocks and value traps. On-the-ground research across Asia provides differentiated local insights that support a high-conviction, bottom-up portfolio with a high active share. By integrating valuation discipline, earnings momentum and a long-term investment horizon, the strategy seeks to generate differentiated alpha across market cycles.
With exposure to fast growing economies and a blend of developed and emerging markets, we continue to believe an allocation to Asia-Pacific in 2026 is an appropriate way to diversify from concentrated positioning in the US.
1Japan share buybacks soar past $100bn, driven by Sony, Hitachi – Nikkei 24 June 2026
THIS WEBSITE IS SOLELY INTENDED FOR PROFESSIONAL INVESTORS, WHICH HAS THE MEANING ASCRIBED TO IT IN THE SECURITIES AND FUTURES ORDINANCE (CAP. 571 OF THE LAWS OF HONG KONG) AND ITS SUBSIDIARY LEGISLATION. Investment involves risks. Past performance is not indicative of future performance. The information contained in this website is provided for reference only and does not constitute investment advice or an offer or solicitation to buy or sell in any securities or to adopt any investment strategy. Investors should not base their investment decisions solely on the information provided on this website and are advised to seek independent advice (including advice on tax implications) before making any investment decisions. Investors should ensure they fully understand the risks associated with the investment products and should also consider their own investment objectives and risk tolerance level. The investment decision is yours. You should not invest unless the intermediary who sells you the investment products has advised you that it is suitable for you and has explained how it is consistent with your investment objectives. Please refer to the relevant offering documents or other legal documents for further details including the risk factors. This website is published by Robeco Hong Kong Limited which is regulated by the Hong Kong Securities and Futures Commission (“SFC”) (CE No. APU851). This website has not been reviewed by the SFC. No assurance can be given that the investment objective of any investment products will be achieved. No representation or promise as to the performance of any investment products or the return on an investment is made. The value of investments may fluctuate. Past performance, projections, or forecasts included in this website should not be regarded as guarantees or indications of future performance, and no express or implied warranty is provided. The contents of this website are based on sources believed to be reliable, but due to the nature of information delivery technology and the necessity of using multiple data sources, including third party content, their accuracy is not guaranteed. The opinions expressed are as of the date shown above and may change as market conditions evolve, and are subject to change without notice. These opinions may differ from those of other Robeco investment professionals. Robeco accepts no liability for any direct, indirect, or consequential loss arising from the use of this material or any comments, opinions, or estimates contained herein. Robeco has no duty to update this website or any website content. Materials on this website may not be reproduced, distributed, or published without prior written permission from Robeco. Unless otherwise specified, Source: Robeco.
Warning – Fraudulent use of Robeco on websites and social media Read more